
Data drives modern business decisions, scientific research, and operational efficiency. Yet even the most sophisticated systems are vulnerable to inaccuracies that can distort outcomes and lead to flawed conclusions. Whether you're managing customer records, financial reports, or experimental results, undetected errors compromise reliability. The ability to systematically identify and calculate these errors is not just a technical skill—it's a foundational practice for data integrity. This guide outlines proven strategies to detect inconsistencies, quantify discrepancies, and strengthen confidence in your datasets.
1. Understand Common Types of Data Errors
Before correcting errors, it’s essential to recognize what you’re looking for. Data errors fall into several categories, each requiring a different detection and resolution approach:
- Entry Errors: Typos, misplaced decimals, or incorrect formatting during manual input.
- Transmission Errors: Corruption during file transfer or API calls.
- Duplicate Records: Redundant entries that skew statistical analysis.
- Misclassification: Assigning data to the wrong category (e.g., labeling “Male” as “Mle”).
- Outliers: Extreme values that may indicate measurement error or genuine anomalies.
- Missing Values: Blank fields that affect completeness and bias models.
Recognizing these patterns allows you to apply targeted validation rules and automated checks.
2. Implement a Step-by-Step Error Detection Workflow
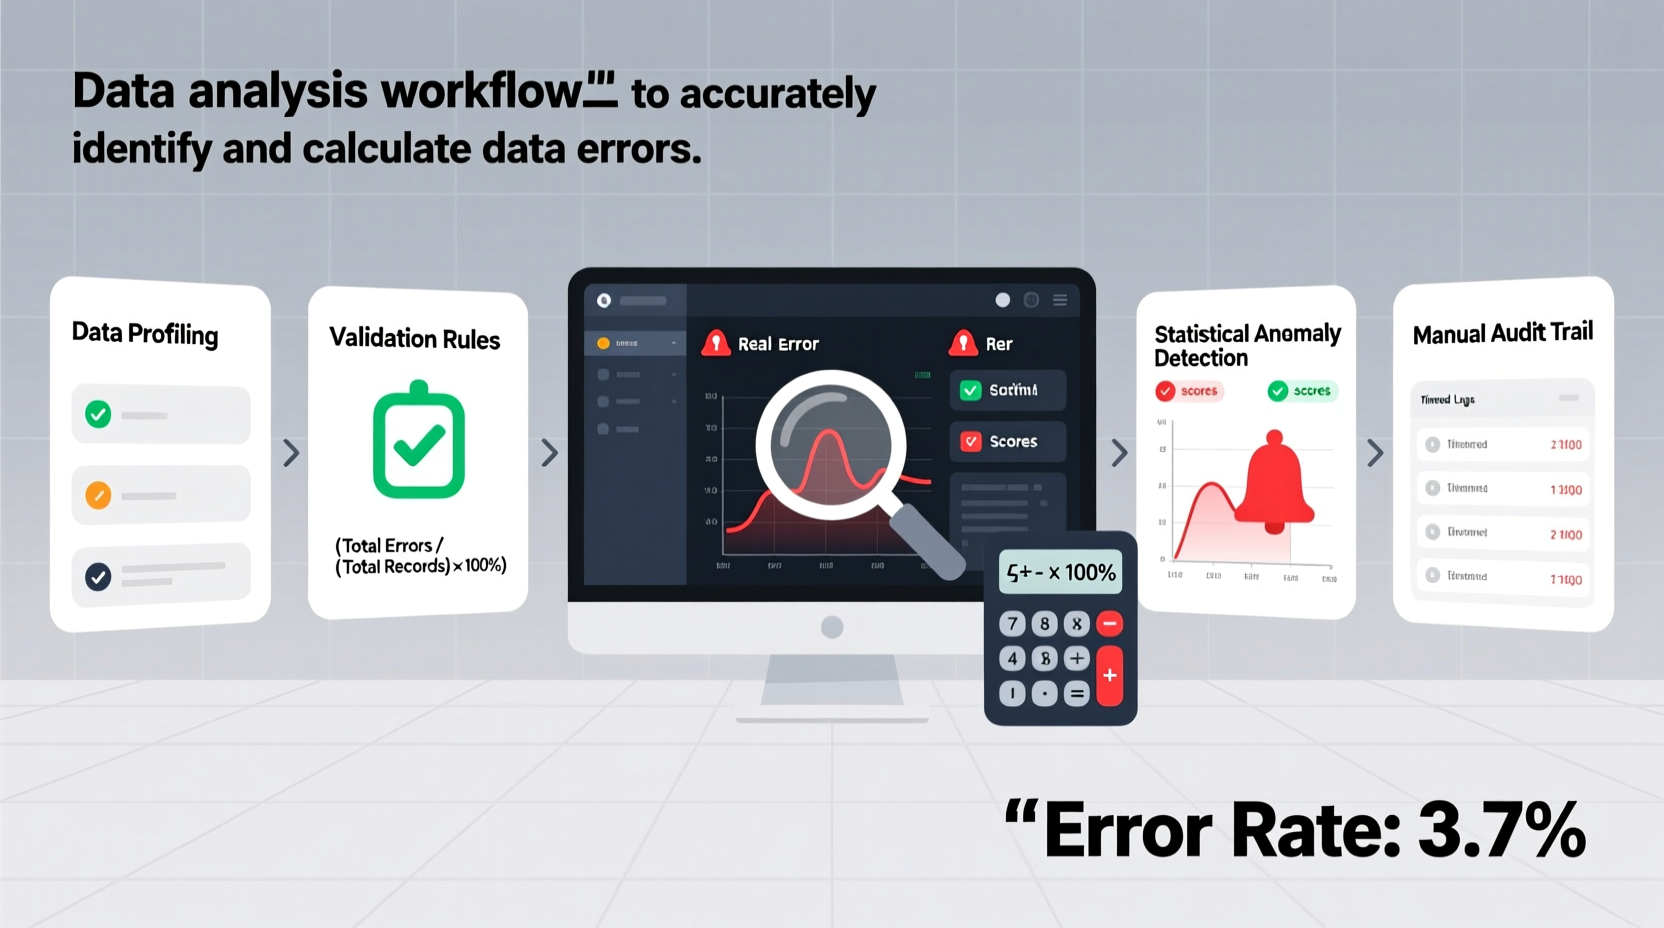
Effective error identification requires a structured process. Follow this timeline to ensure comprehensive coverage:
- Data Profiling: Begin by summarizing key statistics—mean, standard deviation, unique counts, null percentages—to spot irregularities.
- Validation Rules: Define constraints such as expected value ranges (e.g., age between 0–120), format standards (email regex), or referential integrity (foreign keys).
- Cross-Source Verification: Compare data against trusted external sources or historical baselines.
- Anomaly Detection: Apply statistical methods (Z-scores, IQR) or machine learning models to flag outliers.
- Audit Trail Review: Examine logs of data changes to trace when and where errors were introduced.
This sequence transforms error detection from reactive cleanup to proactive quality control.
3. Calculate and Quantify Errors Accurately
Identifying an error is only half the task. To assess impact, you must measure its magnitude. Different metrics apply depending on data type and use case.
| Error Type | Calculation Method | Formula Example |
|---|---|---|
| Numerical Inaccuracy | Mean Absolute Error (MAE) | MAE = (Σ|Actual − Predicted|) / n |
| Percentage Deviation | Relative Error | RE = |(Measured − True)| / True |
| Categorical Mislabeling | Classification Error Rate | Error Rate = Incorrect Labels / Total Labels |
| Missing Data Impact | Completeness Score | % Non-null Entries / Total Entries |
For instance, if sales figures report $10,500 instead of the correct $10,000, the absolute error is $500. The relative error is 5%, which might be acceptable in some contexts but critical in others—such as compliance reporting.
“Error quantification isn’t about perfection; it’s about understanding uncertainty. Every dataset has noise—your job is to know how much.” — Dr. Lena Torres, Data Quality Researcher at MIT
4. Real-World Case Study: Fixing Inventory Discrepancies in Retail
A national retail chain noticed growing mismatches between digital inventory levels and physical stock audits. Weekly variance averaged 8%, leading to overstocking and lost sales. A cross-functional team was formed to investigate.
Their process began with data profiling across point-of-sale, warehouse management, and e-commerce systems. They discovered:
- Timezone misalignment causing double-counting of midnight transactions.
- Manual overrides in POS systems bypassing central logging.
- Product SKUs inconsistently formatted (e.g., “SKU-100”, “sku100”, “100”).
Using Python scripts, they standardized SKU formats, synchronized timestamps, and flagged override entries for review. After six weeks of iterative cleaning, the error rate dropped to 1.2%. Financial forecasting accuracy improved by 27%, and warehouse labor costs decreased due to fewer emergency reconciliations.
This example underscores that errors often stem not from malice or negligence, but from system integration gaps and inconsistent protocols.
5. Best Practices Checklist for Sustainable Data Accuracy
Maintaining clean data is ongoing. Use this checklist to embed error prevention into daily operations:
- ✅ Conduct weekly data health audits using automated scripts.
- ✅ Enforce mandatory field validation at entry points (forms, APIs).
- ✅ Standardize naming conventions and units across departments.
- ✅ Train staff on common data pitfalls and correction procedures.
- ✅ Document all data transformations and corrections in a changelog.
- ✅ Set up real-time alerts for threshold breaches (e.g., >5% drop in completeness).
- ✅ Perform quarterly reconciliation with authoritative sources.
Common Pitfalls to Avoid
Even experienced analysts make preventable mistakes. Be mindful of these traps:
| Do’s | Don’ts |
|---|---|
| Validate data at both input and processing stages. | Rely solely on end-stage analysis to catch errors. |
| Treat missing data deliberately (impute, exclude, flag). | Ignore blank fields as “harmless.” |
| Use version control for datasets undergoing edits. | Overwrite original files without backup. |
| Communicate error thresholds clearly to stakeholders. | Assume everyone shares your definition of “acceptable accuracy.” |
One frequent oversight is treating all errors equally. A 2% error in temperature readings for HVAC systems may be tolerable, but the same margin in pharmaceutical dosage tracking is unacceptable. Context determines severity.
FAQ
How do I distinguish between a true outlier and a data error?
Start by verifying the source. If the value falls outside plausible physical or logical bounds (e.g., human height of 10 feet), it’s likely an error. Otherwise, use statistical tests like Grubbs’ test or visualizations (box plots) to assess significance. Domain knowledge is crucial—consult subject matter experts when uncertain.
What should I do when I find systemic errors across multiple databases?
Trace the root cause through lineage mapping. Determine whether the issue originates in collection, transformation, or integration. Prioritize fixing upstream sources rather than patching downstream outputs. Coordinate with IT and data governance teams to implement preventive controls.
Can AI reliably detect data errors?
AI and machine learning can enhance detection—especially for complex patterns like subtle drift or contextual anomalies—but they’re not foolproof. Models trained on dirty data may learn incorrect patterns. Always combine AI tools with rule-based validation and human review.
Conclusion
Accurate data is the bedrock of trustworthy insights. By adopting systematic strategies to identify and calculate errors, organizations move from reactive firefighting to proactive stewardship. From validating inputs to quantifying discrepancies and learning from real-world cases, every step strengthens data credibility. These practices don’t eliminate human or technical flaws—they create resilience against them.


 浙公网安备
33010002000092号
浙公网安备
33010002000092号 浙B2-20120091-4
Comments
No comments yet. Why don't you start the discussion?