
Memory leaks remain one of the most insidious performance issues in software development. Unlike crashes or syntax errors, they don’t always manifest immediately. Instead, they quietly degrade system performance over time, eventually leading to application slowdowns, unresponsiveness, or even system-wide instability. Whether you're working with JavaScript in a browser, native code on mobile devices, or complex desktop applications, understanding how to detect and eliminate memory leaks is essential for building robust, scalable software.
The challenge lies not only in identifying where memory is being retained unnecessarily but also in knowing which tools and techniques are most effective across different runtime environments. This guide provides actionable strategies, platform-specific insights, and real-world examples to help developers systematically tackle memory leaks wherever they occur.
Understanding Memory Leaks: The Root Cause
A memory leak occurs when allocated memory is no longer needed by the application but isn't released back to the system. Over time, these unreleased blocks accumulate, consuming more and more resources. While garbage-collected languages like JavaScript, Java, and C# reduce the risk of traditional leaks, improper object referencing can still prevent automatic cleanup.
In native environments such as C++ or Rust (without garbage collection), manual memory management increases the risk if developers fail to deallocate memory explicitly. Common causes include:
- Event listeners that are never removed
- Dangling references in closures or callbacks
- Cached data structures without expiration policies
- Improper lifecycle handling in UI components (e.g., Android activities or React components)
- Global variables holding onto large objects
“Memory leaks often start small—just a few kilobytes here and there—but compound rapidly under sustained usage. The key is early detection.” — Dr. Lin Zhao, Systems Performance Engineer at Mozilla
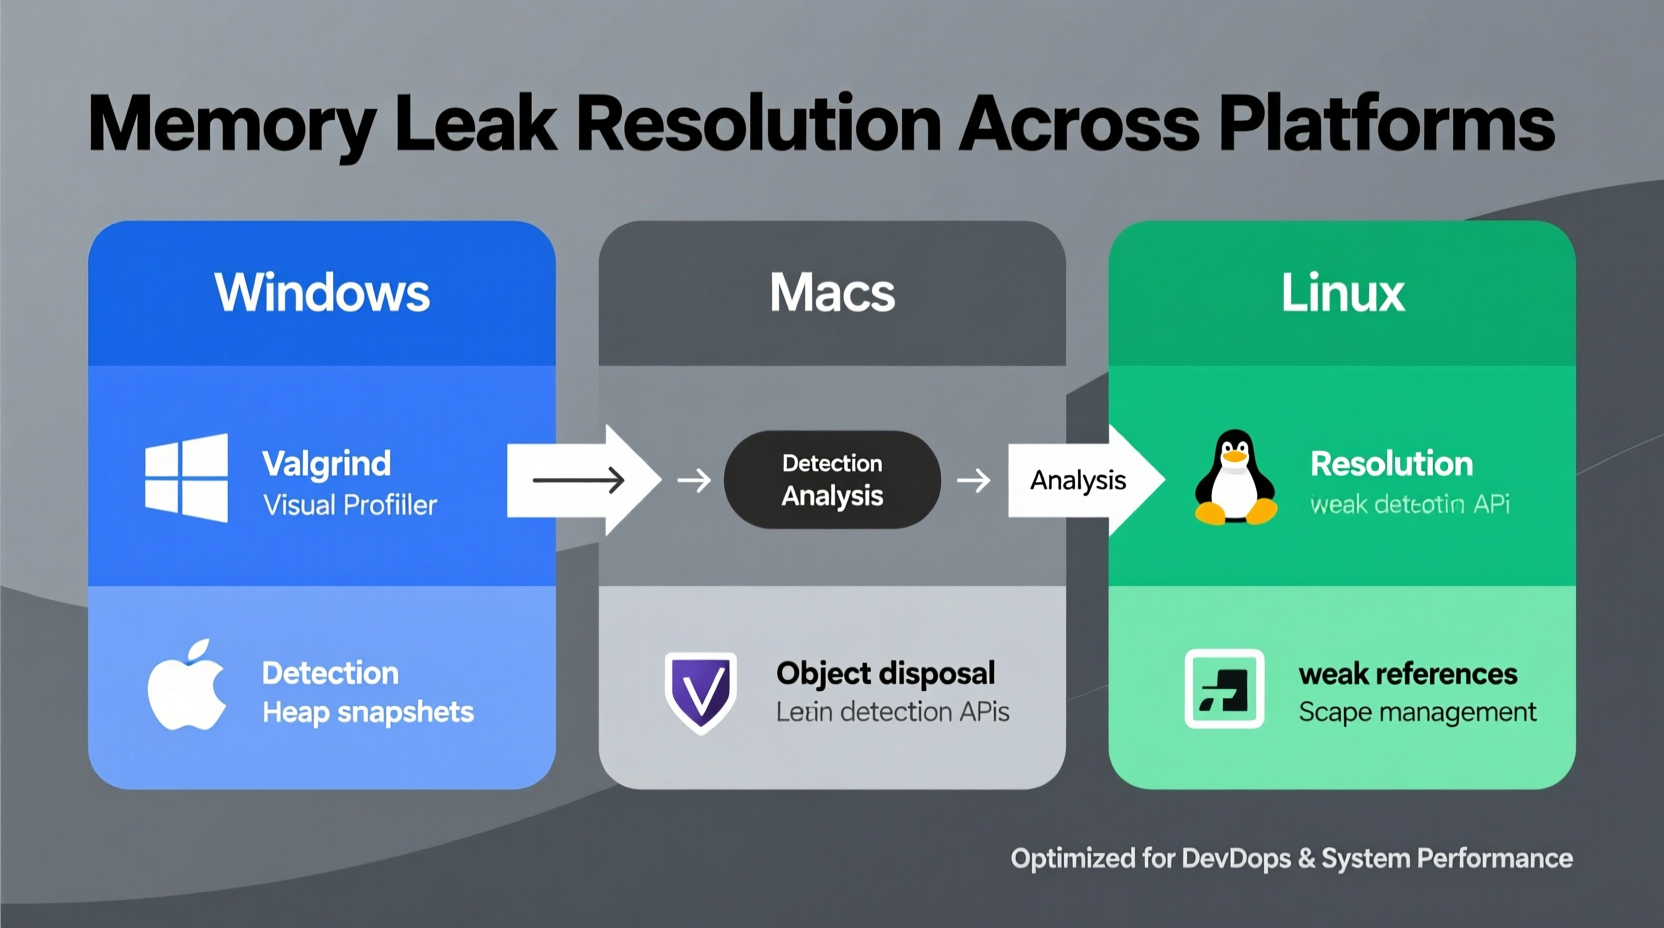
Platform-Specific Detection Techniques
Different platforms offer unique tooling and behaviors that affect how memory leaks appear and are diagnosed. Below is a breakdown of effective detection methods by environment.
Web Applications (JavaScript/Node.js)
Browsers provide powerful developer tools to monitor memory usage. Chrome DevTools includes a heap profiler and allocation timeline that can track object creation and retention.
To isolate leaks:
- Open DevTools > Memory tab
- Take a heap snapshot before and after an operation
- Compare snapshots to see which objects persist unexpectedly
- Look for detached DOM trees or closures retaining outer scopes
In Node.js, use process.memoryUsage() to log memory consumption over time. Tools like clinic.js or ndb allow deep inspection of long-running processes.
Android (Java/Kotlin)
Android Studio’s Memory Profiler enables real-time monitoring of app memory. A common cause of leaks is holding context references in static fields or background threads.
For example, a leaked activity might look like this:
public class MainActivity extends AppCompatActivity {
    private static Context context; // Dangerous!

    @Override
    protected void onCreate(Bundle savedInstanceState) {
        super.onCreate(savedInstanceState);
        context = this; // Retains entire Activity
    }
}
This prevents garbage collection of the activity even after it's destroyed. Use WeakReference<Context> instead, or better yet, avoid static context altogether.
iOS (Swift/Objective-C)
Xcode’s Instruments suite includes the Allocations andLeaks tools. The latter detects classic C-style leaks (malloc/free mismatches), while the former helps analyze object graphs.
A frequent issue arises from retain cycles in closures:
class NetworkManager {
    var completion: (() -> Void)?

    func fetchData() {
        self.completion = { [weak self] in
            print(\"Fetched data\")
            // Without [weak self], a cycle forms if NetworkManager holds the closure
        }
    }
}
Always use [weak self] or [unowned self] in closures that capture self to break potential retain cycles.
Desktop (C++, .NET)
In C++, memory leaks stem from unmatched new/delete calls. Static analysis tools like Valgrind (Linux) or AddressSanitizer (cross-platform) can detect unfreed blocks.
.NET applications benefit from the Diagnostic Tools window in Visual Studio. Analyze object lifetimes using GC root tracking to find what’s keeping objects alive.
| Platform | Primary Tool | Common Leak Source |
|---|---|---|
| Web (Browser) | Chrome DevTools | Detached DOM nodes, event listeners |
| Node.js | Clinic.js, ndb | Global caches, unclosed streams |
| Android | Android Studio Profiler | Static context, AsyncTask leaks |
| iOS | Xcode Instruments | Retain cycles in delegates/closures |
| C++ | Valgrind, ASan | Missing delete calls |
| .NET | Visual Studio Diagnostics | Event handler subscriptions |
Step-by-Step Guide to Fixing Memory Leaks
Follow this structured approach to diagnose and resolve memory leaks effectively:
- Reproduce the Issue: Perform consistent actions that trigger suspected memory growth (e.g., navigating between views).
- Monitor Memory Usage: Use platform-specific profilers to record baseline and peak memory consumption.
- Take Snapshots: Capture memory state before and after the test scenario.
- Analyze Object Retention: Identify objects that persist despite being out of scope. Look for unexpected parents or roots.
- Trace References: Determine what chain of references is preventing garbage collection.
- Modify Code: Remove unnecessary references, implement weak pointers, or unsubscribe from events.
- Verify Fix: Repeat profiling to confirm memory stabilizes over repeated operations.
Mini Case Study: Resolving a Web Dashboard Leak
A financial dashboard built with React began slowing down after 15 minutes of continuous use. Users reported lag when switching charts. Initial investigation showed rising memory usage in Chrome Task Manager.
Using the Memory tab, engineers recorded heap snapshots every two minutes. They noticed increasing instances of ChartComponent objects—even though only one was rendered at a time.
Further analysis revealed that event listeners attached to window during chart initialization were never cleaned up. Each route change created a new instance but left old listeners active.
The fix involved adding a cleanup function in useEffect:
useEffect(() => {
  const handler = () => updateChart();
  window.addEventListener('resize', handler);

  return () => {
    window.removeEventListener('resize', handler); // Cleanup
  };
}, []);
After deployment, memory usage stabilized, and performance complaints ceased.
Essential Checklist for Preventing Memory Leaks
- ✅ Always remove event listeners when components are destroyed
- ✅ Avoid storing large objects in global or static variables
- ✅ Use weak references (
WeakMap,WeakSet,WeakReference) where appropriate - ✅ Unsubscribe from observables, promises, or callbacks in cleanup routines
- ✅ Limit caching without size bounds or expiration mechanisms
- ✅ Profile memory regularly during development and staging
- ✅ Audit third-party libraries for known memory issues
Frequently Asked Questions
Can garbage-collected languages have memory leaks?
Yes. While automatic garbage collection handles deallocation, unreachable memory isn't the issue—retained memory is. Objects kept alive unintentionally (e.g., via closures or caches) create logical leaks even in managed runtimes.
How do I know if my app has a memory leak?
Monitor memory usage over time. If it grows steadily during normal operation and doesn’t drop after idle periods or navigation, a leak is likely. Sudden spikes followed by partial drops may indicate inefficient cleanup.
Are memory leaks permanent?
No. Most are resolved when the process terminates. However, in long-running applications (servers, dashboards, mobile apps), they can cause service degradation or crashes before restart.
Conclusion: Proactive Monitoring Saves Time and Resources
Memory leaks are avoidable with disciplined coding practices and regular performance scrutiny. By integrating memory profiling into your development workflow and adopting defensive patterns—like proper cleanup and weak referencing—you can build applications that remain responsive and stable under real-world conditions.
The cost of ignoring memory issues compounds quickly: slower user experiences, higher server costs, increased crash rates. But with the right tools and habits, developers can catch problems early and deliver efficient, reliable software across all platforms.


 浙公网安备
33010002000092号
浙公网安备
33010002000092号 浙B2-20120091-4
Comments
No comments yet. Why don't you start the discussion?