
Visual thinking tools like flowcharts and dichotomous keys have long been used across disciplines to simplify complex processes. Whether identifying species in biology or troubleshooting technical issues in IT, these structured diagrams help break down decisions into manageable steps. While they serve different primary functions, both rely on logical progression and binary choices to guide users toward accurate conclusions. Understanding their structure, applications, and strengths reveals why flowcharts, in particular, remain indispensable in modern problem-solving.
What Are Flowcharts and Dichotomous Keys?
A flowchart is a diagram that represents a process or system using standardized symbols—such as rectangles for actions, diamonds for decisions, and arrows for directional flow. It provides a visual roadmap of how tasks proceed from start to finish, making it easier to analyze, optimize, or communicate workflows.
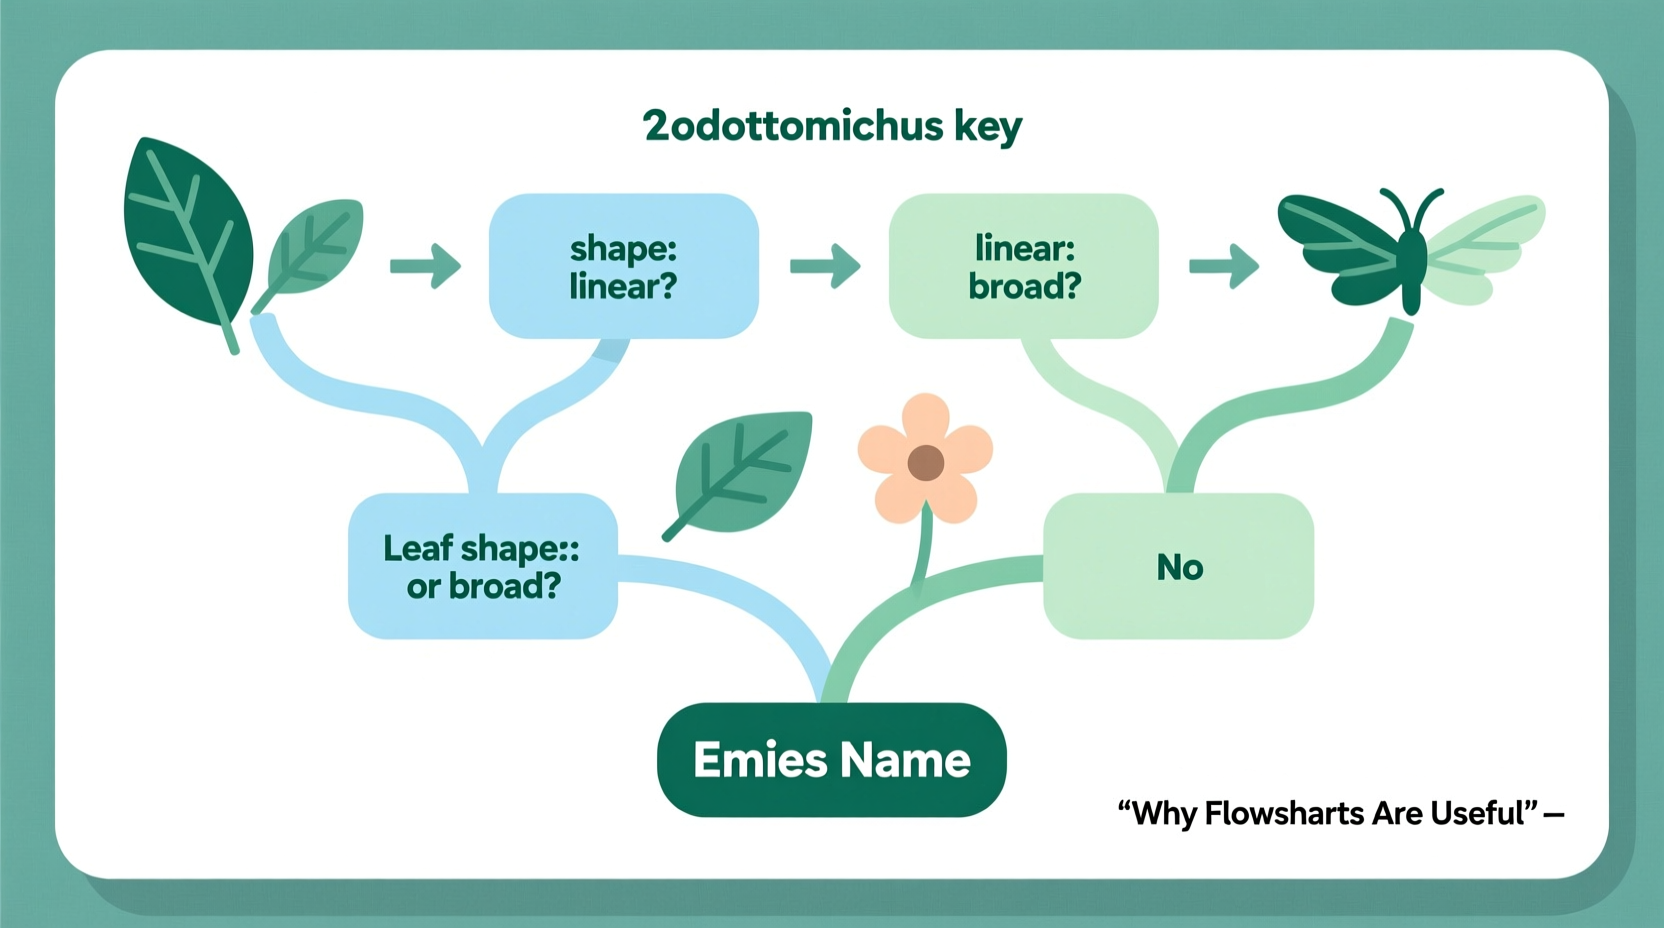
In contrast, a dichotomous key is a scientific tool primarily used in biology and taxonomy to identify organisms based on a series of paired, contrasting characteristics. At each step, the user chooses one of two options (e.g., “leaves needle-like” vs. “leaves broad”), progressively narrowing down possibilities until reaching a specific identification.
Though distinct in origin and typical use case, both tools share a foundational principle: guiding users through a sequence of decisions to reach a clear outcome. This makes them highly effective for reducing ambiguity and improving accuracy in high-stakes or knowledge-intensive environments.
Why Flowcharts Are Useful: Key Advantages
Flowcharts offer unique benefits that make them more versatile than dichotomous keys in many real-world scenarios. Their adaptability spans industries—from software development and healthcare to customer service and education.
- Clarity in Complexity: They transform abstract or intricate procedures into digestible visuals, helping teams understand dependencies and bottlenecks.
- Error Detection: By mapping out every possible path, flowcharts expose gaps, redundancies, or logical flaws in a process.
- Improved Communication: A well-designed flowchart acts as a universal language, bridging communication gaps between technical and non-technical stakeholders.
- Training & Onboarding: New employees can quickly grasp operational workflows without relying solely on verbal instruction.
- Standardization: Organizations use flowcharts to enforce consistent practices across departments or locations.
“Visualizing a process often reveals inefficiencies no amount of discussion could uncover.” — Dr. Lena Patel, Operations Research Analyst
Comparing Flowcharts and Dichotomous Keys
While both tools rely on sequential logic, their purposes and structures differ significantly. The table below highlights key distinctions:
| Feature | Flowchart | Dichotomous Key |
|---|---|---|
| Purpose | Map processes, workflows, or algorithms | Identify unknown items (usually biological) |
| Structure | Multiple symbols, loops, branches | Paired yes/no questions only |
| Flexibility | High – supports complex logic | Low – strictly linear decision tree |
| Use Cases | Software design, project planning, customer support | Biology labs, field guides, environmental studies |
| User Interaction | Passive viewing or active execution | Active selection at each step |
The rigidity of dichotomous keys ensures precision in identification but limits their application outside classification tasks. Flowcharts, by contrast, can model feedback loops, parallel paths, and conditional exits—making them ideal for dynamic systems where outcomes depend on variable inputs.
Real-World Example: Diagnosing Network Issues
A mid-sized tech company was experiencing frequent employee complaints about slow internet. Instead of assigning technicians randomly, the IT manager created a flowchart for diagnosing connectivity problems. Starting with “Is the device connected to Wi-Fi?” the chart branched into checks for router status, DNS settings, firewall rules, and bandwidth usage.
Within two weeks, average resolution time dropped by 40%. Technicians followed the same logic every time, eliminating guesswork. Meanwhile, junior staff used the flowchart independently, reducing reliance on senior engineers. This case illustrates how flowcharts standardize expertise and scale solutions efficiently.
How to Create an Effective Flowchart: Step-by-Step Guide
Designing a useful flowchart doesn’t require advanced software—just clarity of purpose and attention to structure. Follow this five-step process:
- Define the Objective: Clearly state what process you’re mapping and who will use it. Is it for internal training? Customer self-service?
- List All Steps: Break the process into individual actions, decisions, and endpoints. Include all possible variations (e.g., approval vs. rejection).
- Arrange in Logical Order: Use standard symbols: ovals for start/end points, rectangles for tasks, diamonds for decisions.
- Add Clear Labels: Each symbol should have concise, unambiguous text. Avoid jargon unless your audience is specialized.
- Test and Refine: Walk through the flowchart with someone unfamiliar with the process. Note where confusion arises and revise accordingly.
When to Use a Dichotomous Key Instead
Despite the versatility of flowcharts, dichotomous keys excel in specific contexts—particularly when identifying unknowns based on observable traits. For example, a botanist in the field might carry a printed key to distinguish between similar-looking plant species using leaf shape, flower color, and stem texture.
Dichotomous keys work best when:
- The goal is identification, not process execution.
- Characteristics are clearly observable and mutually exclusive.
- The user lacks deep domain knowledge but needs reliable results.
In educational settings, students learning taxonomy benefit from dichotomous keys because they reinforce observational skills and deductive reasoning. However, even here, educators often convert traditional keys into flowchart-style diagrams to improve engagement and comprehension.
Frequently Asked Questions
Can a dichotomous key be turned into a flowchart?
Yes. In fact, many modern biology textbooks present dichotomous keys as simplified flowcharts using decision diamonds and arrows. This format improves usability, especially for digital learners.
Are flowcharts outdated in the age of automation?
No. While automated workflows exist in software like Zapier or Microsoft Power Automate, flowcharts remain essential for designing, documenting, and debugging those systems. You can't automate what you can't map.
Do I need special software to create flowcharts?
Not necessarily. Tools like pen and paper, whiteboards, Google Drawings, or even PowerPoint can produce effective flowcharts. For more advanced needs, consider Lucidchart, Draw.io, or Miro.
Actionable Checklist: Building Better Decision Tools
Before finalizing your next flowchart or key, run through this checklist:
- ☑ Define the exact purpose and audience
- ☑ Use consistent symbols and formatting
- ☑ Ensure every decision has clear, binary options
- ☑ Test the diagram with a new user
- ☑ Label all paths and include a legend if needed
- ☑ Keep it simple—remove unnecessary steps
Conclusion: Leverage Visual Logic for Smarter Decisions
Both flowcharts and dichotomous keys harness the power of structured thinking, but flowcharts offer broader utility in today’s fast-paced, interconnected world. From streamlining operations to enhancing learning, their ability to clarify complexity makes them invaluable. While dichotomous keys retain niche importance in scientific identification, adapting their logic into flowchart formats can boost accessibility and effectiveness.


 浙公网安备
33010002000092号
浙公网安备
33010002000092号 浙B2-20120091-4
Comments
No comments yet. Why don't you start the discussion?