
Water is fundamental to life, yet its quality can vary dramatically based on geographic location, industrial activity, and natural mineral deposits. While water testing is a routine practice in environmental monitoring, public health, and industrial processes, not all analyses are straightforward. Some samples present extreme challenges due to complex matrices, unstable analytes, or trace-level contaminants. Understanding the hardest water sample analysis factors—and why they matter—is essential for ensuring reliable data that informs regulatory decisions, protects ecosystems, and safeguards human health.
The Complexity of Water Matrices
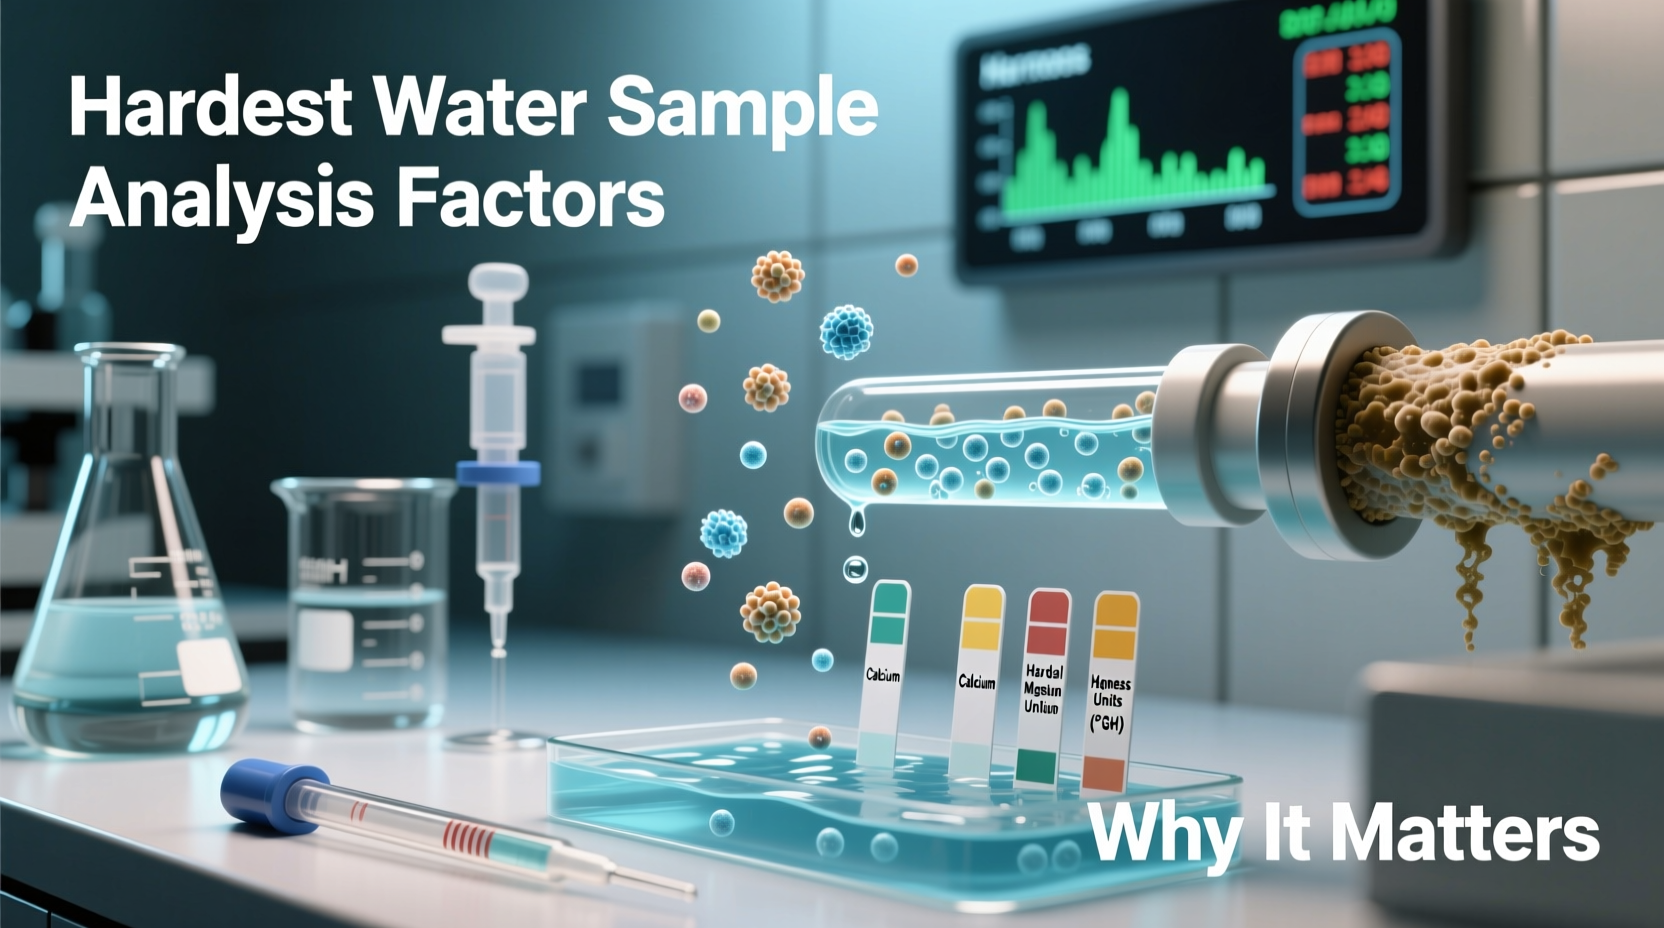
One of the primary hurdles in water analysis lies in the diversity and complexity of water matrices. A \"matrix\" refers to all components in a sample besides the target analyte—such as dissolved solids, organic matter, microorganisms, and suspended particles. Groundwater, wastewater, seawater, and storm runoff each have vastly different compositions, which interfere with analytical accuracy.
For example, high levels of total dissolved solids (TDS) in brackish or industrial effluent can suppress signals in spectrometric methods or clog filtration systems. Organic-rich surface waters may degrade chemical reagents or bind with metals, making them harder to detect. These interferences require extensive sample preparation, including digestion, dilution, or solid-phase extraction, increasing both time and error potential.
Trace Contaminants and Detection Limits
Some of the most difficult analyses involve detecting contaminants at ultra-trace levels—parts per billion (ppb) or even parts per trillion (ppt). Emerging pollutants such as pharmaceuticals, perfluorinated compounds (PFAS), and endocrine disruptors fall into this category. Their low concentrations demand highly sensitive instrumentation like liquid chromatography-tandem mass spectrometry (LC-MS/MS) or inductively coupled plasma mass spectrometry (ICP-MS).
However, sensitivity brings its own challenges. Background noise, reagent impurities, and cross-contamination from labware can produce false positives or mask true signals. PFAS, for instance, are so pervasive in laboratory environments—from Teflon-lined vials to fluorinated tubing—that blank contamination is a constant concern.
“Analyzing PFAS at environmentally relevant levels isn’t just about having the right machine—it’s about controlling every variable from sampling bottle to data output.” — Dr. Lena Torres, Environmental Chemist, U.S. EPA
Sample Stability and Preservation Challenges
Not all analytes remain stable once a sample is collected. Metals can adsorb onto container walls; volatile organic compounds (VOCs) may evaporate; bacteria can alter nutrient concentrations within hours. This makes preservation and rapid processing critical.
For example, nitrate and phosphate levels in agricultural runoff can shift rapidly due to microbial activity if samples aren’t chilled immediately. Similarly, hexavalent chromium (Cr-VI)—a known carcinogen—can be reduced to less toxic Cr-III during storage if pH isn’t tightly controlled.
Field preservation often requires adding acids, bases, or biocides, but these must be precisely dosed. Over-acidification can dissolve particulate metals, inflating dissolved metal readings. Under-preservation risks biological degradation. The margin for error is narrow.
Common Preservation Requirements by Analyte
| Analyte | Preservation Method | Holding Time |
|---|---|---|
| Nitrate | Refrigeration (4°C) | 48 hours |
| Total Metals | Acidify to pH <2 with HNO₃ | 6 months |
| VOCs | Add NaHSO₃, refrigerate, no headspace | 14 days |
| Pesticides | Refrigerate, amber glass | 14 days |
| Bacteria | Refrigerate, analyzed within 6–8 hours | 8 hours |
Interference from Co-Occurring Substances
Many analytical techniques rely on specific physical or chemical responses—absorbance, fluorescence, ionization—but these can be disrupted by co-existing substances. For instance, high iron content can interfere with arsenic detection in ICP-MS due to spectral overlap unless collision cell technology is used.
In colorimetric tests for phosphate, silicate ions can produce similar hues, leading to overestimation unless masked with oxalic acid. Similarly, chloride-rich seawater complicates mercury analysis because chlorine forms polyatomic interferences.
Correcting for these interferences requires either advanced instrumentation capable of interference removal (e.g., triple quadrupole ICP-MS) or method modifications validated through spike recovery tests and matrix-matched calibration.
Real-World Example: Flint Water Crisis
The Flint, Michigan water crisis offers a stark illustration of how flawed water analysis can have catastrophic consequences. In 2014, when the city switched its water source to the Flint River, corrosive water leached lead from aging pipes. Initial sampling protocols failed to capture the severity due to improper collection methods—residents were told to flush taps before sampling, which artificially lowered lead levels.
Moreover, some samples were analyzed without proper acid digestion, missing particulate-bound lead. Independent researchers later found lead concentrations exceeding 10,000 ppb in some homes—over 600 times the EPA action level.
This case underscores that even technically sound labs can generate misleading results if sampling design, preservation, and reporting fail to account for real-world variability and chemical behavior.
Step-by-Step Guide to Robust Water Analysis
To overcome the hardest factors in water sample analysis, follow this structured approach:
- Define Objectives Clearly: Identify target analytes and required detection limits based on regulatory or research needs.
- Select Appropriate Methods: Match analytical techniques to analyte properties (e.g., GC-MS for VOCs, IC for anions).
- Characterize the Matrix: Measure pH, conductivity, turbidity, and TDS before analysis to anticipate interferences.
- Use Proper Sampling Protocols: Employ clean, material-appropriate containers; preserve immediately; avoid contamination.
- Implement Quality Controls: Include blanks, duplicates, spikes, and reference materials in every batch.
- Validate Results: Confirm anomalies with alternate methods or independent labs.
- Document Everything: Maintain chain-of-custody records and detailed method notes for audit readiness.
Why Accurate Water Analysis Matters
Reliable water testing directly impacts public health, environmental protection, and industrial compliance. Misleading data can result in unchecked pollution, unsafe drinking water, or unnecessary regulatory penalties. In agriculture, inaccurate nutrient measurements can lead to over-fertilization and algal blooms. In pharmaceutical manufacturing, water purity affects product safety and efficacy.
Furthermore, climate change is increasing the frequency of extreme weather events, leading to more frequent contamination from flooding, saltwater intrusion, and wildfire runoff. As water sources become more stressed, the need for precise, resilient analytical practices grows more urgent.
Frequently Asked Questions
What makes certain water samples harder to analyze than others?
Samples with high turbidity, salinity, organic content, or unstable analytes are more challenging due to interference, matrix effects, and degradation risks. Industrial or contaminated waters often require specialized handling and advanced instrumentation.
How can laboratories reduce errors in water analysis?
Labs can minimize errors by using certified reference materials, conducting regular instrument calibration, applying appropriate preservation techniques, performing matrix spike recoveries, and adhering to standardized methods like those from EPA, ISO, or ASTM.
Is field testing reliable for hard-to-analyze water samples?
Field kits are useful for screening but lack the precision of lab-based instruments for trace contaminants or complex matrices. They should be followed up with confirmatory lab analysis, especially when regulatory decisions are involved.
Final Checklist for High-Quality Water Sample Analysis
- ☑ Use contamination-free sampling containers
- ☑ Preserve samples according to analyte requirements
- ☑ Keep samples cold during transport
- ☑ Perform matrix characterization before analysis
- ☑ Include blanks, duplicates, and spikes in every run
- ☑ Validate critical findings with secondary methods
- ☑ Follow accredited standard operating procedures (SOPs)
Conclusion
The difficulty of water sample analysis isn't merely a technical challenge—it's a gateway to truth in environmental science and public health. When samples contain complex mixtures, unstable compounds, or trace toxins, the margin for error shrinks dramatically. Yet, with rigorous methodology, proper training, and unwavering attention to detail, accurate results are achievable.
Whether you're managing municipal water supplies, monitoring industrial discharges, or studying ecosystem health, never underestimate the power of a well-analyzed water sample. It can prevent disease, protect wildlife, and inform policy. Take the time to get it right—because when it comes to water, there’s no second chance.


 浙公网安备
33010002000092号
浙公网安备
33010002000092号 浙B2-20120091-4
Comments
No comments yet. Why don't you start the discussion?