
Understanding a company’s growth rate is essential for investors, entrepreneurs, and financial analysts. It provides insight into performance trends, helps forecast future earnings, and supports strategic planning. While the concept may seem straightforward, accurately calculating and interpreting growth rates requires attention to detail, consistency in data selection, and awareness of potential pitfalls. This guide walks you through the process methodically, ensuring your analysis is both reliable and actionable.
Why Growth Rate Matters in Business Analysis
Growth rate quantifies the change in a company’s key metrics—such as revenue, profit, or user base—over time. It serves as a vital indicator of health and momentum. A consistently positive growth rate suggests effective management, market demand, and scalability. Conversely, stagnation or decline can signal operational inefficiencies or competitive pressures.
For stakeholders, growth rate informs critical decisions:
- Investors use it to assess valuation and potential returns.
- CEOs rely on it to adjust strategy and allocate resources.
- Lenders evaluate it to determine creditworthiness.
However, raw percentage changes can be misleading without context. Seasonal fluctuations, one-time events, or accounting adjustments may distort results. That’s why a structured approach is crucial.
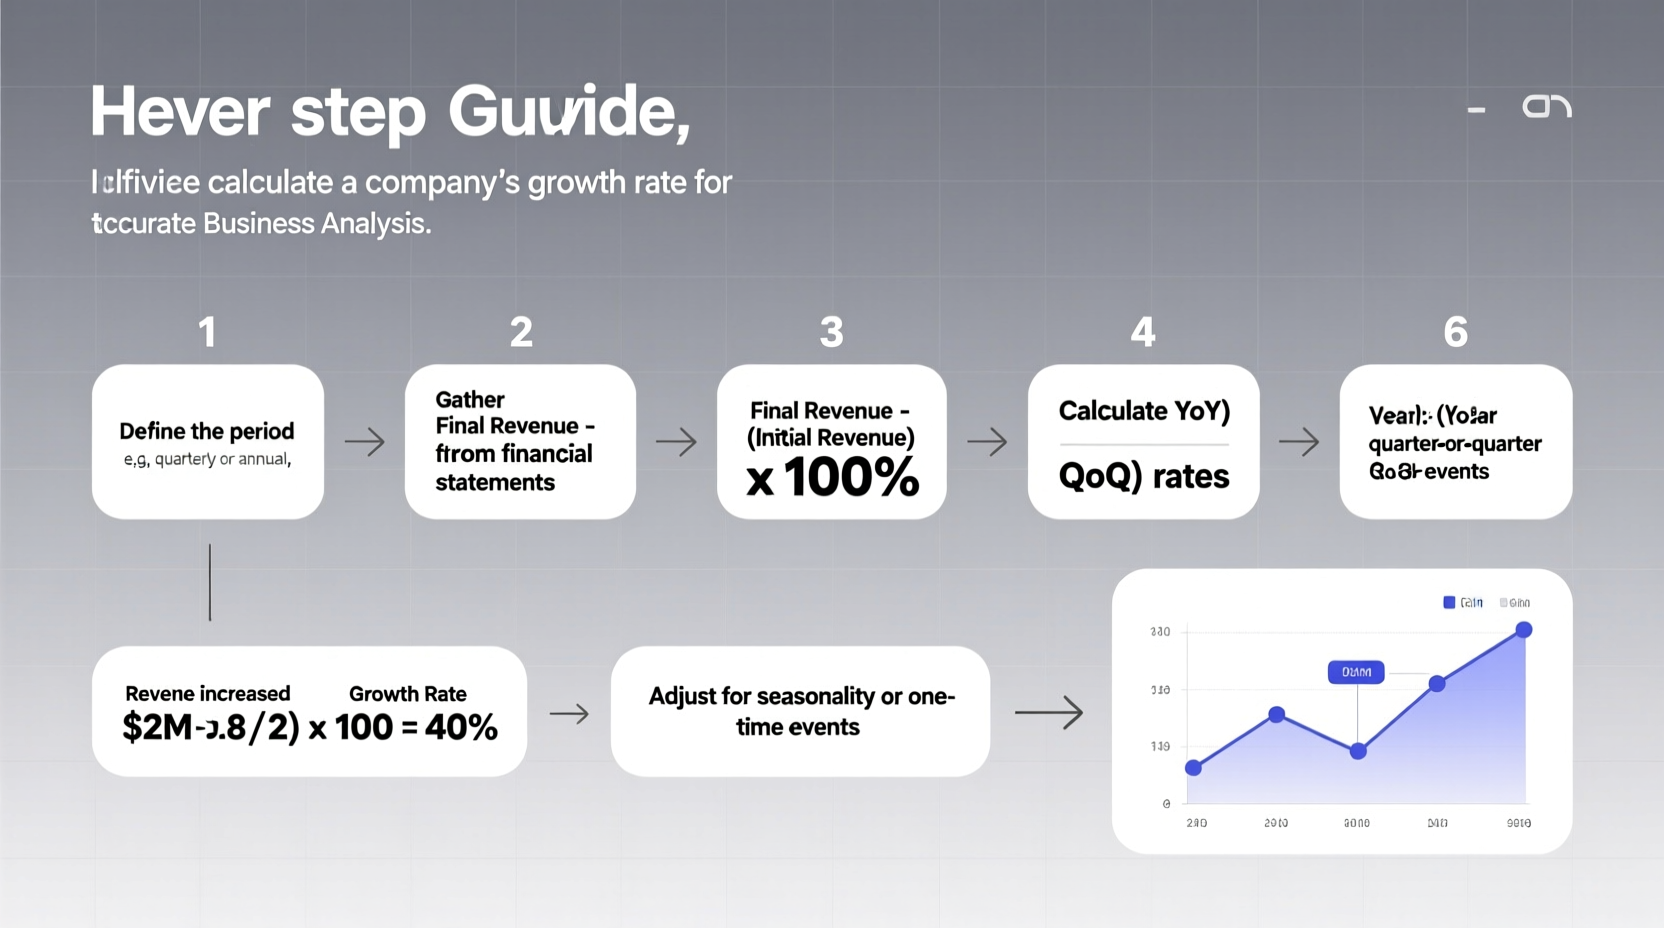
Step-by-Step Guide to Calculating Growth Rate
The most common formula for calculating growth rate is the Compound Annual Growth Rate (CAGR), which smooths out volatility and provides an annualized figure. Here’s how to apply it correctly.
- Choose the Metric to Analyze
Select a measurable business indicator such as revenue, net income, EBITDA, or customer count. Ensure it aligns with your objective—e.g., revenue growth for market expansion, profit growth for efficiency. - Define the Time Period
Pick two points: a starting value and an ending value. Common intervals are year-over-year (YoY), quarter-over-quarter (QoQ), or multi-year periods. For CAGR, at least two years of data are required. - Gather Accurate Historical Data
Use audited financial statements, internal reports, or trusted databases like Bloomberg or SEC filings. Avoid estimates unless clearly labeled. - Apply the CAGR Formula
Use the following equation:CAGR = (Ending Value / Beginning Value)^(1/n) – 1
Where:
• Ending Value = Value at end of period
• Beginning Value = Value at start of period
• n = Number of years - Interpret the Result
Multiply by 100 to express as a percentage. A 10% CAGR means the metric grew at an average rate of 10% per year over the period.
Real Example: Analyzing TechStart Inc.’s Revenue Growth
TechStart Inc., a SaaS startup, reported the following annual revenues:
| Year | Revenue ($) |
|---|---|
| 2020 | 500,000 |
| 2021 | 720,000 |
| 2022 | 980,000 |
| 2023 | 1,400,000 |
To calculate the 3-year CAGR from 2020 to 2023:
(1,400,000 / 500,000)^(1/3) – 1 = (2.8)^(0.333) – 1 ≈ 1.41 – 1 = 0.41
CAGR = 41%
This indicates TechStart grew its revenue at an average annual rate of 41% over three years—a strong signal of market traction. However, further analysis reveals that 2021 included a one-time government grant of $120,000. Adjusting for this, real organic revenue was $600,000 in 2021, slightly lowering the sustainable growth trajectory.
“Growth rates are only as good as the data behind them. Scrub your numbers clean of anomalies before drawing conclusions.” — Dr. Lena Patel, Financial Analyst at StratVest Capital
Common Pitfalls and How to Avoid Them
Even experienced analysts can misinterpret growth rates due to oversights. Below are frequent errors and their solutions:
| Pitfall | Impact | Solution |
|---|---|---|
| Using inconsistent time frames | Skews comparison across periods | Standardize all data to full fiscal years or matching quarters |
| Ignoring inflation | Overstates real growth in long-term analysis | Use real (inflation-adjusted) values when comparing over 3+ years |
| Cherry-picking peak years | Creates false impression of sustained growth | Analyze multiple periods and consider moving averages |
| Not adjusting for acquisitions or divestitures | Inflates or understates organic performance | Isolate core business metrics where possible |
Checklist for Accurate Growth Rate Calculation
Before finalizing your analysis, run through this checklist to ensure reliability:
- ✅ Selected a relevant and consistent metric (e.g., revenue, not total assets)
- ✅ Verified data comes from audited or reliable sources
- ✅ Confirmed time periods are aligned (e.g., full fiscal years)
- ✅ Adjusted for one-time events (bonuses, asset sales, grants)
- ✅ Applied the correct formula (CAGR for multi-year, simple % change for YoY)
- ✅ Considered inflation for long-term comparisons
- ✅ Cross-checked with industry benchmarks for context
When to Use Alternative Growth Metrics
While CAGR is powerful, other methods offer complementary insights:
- Year-over-Year (YoY) Growth: Compares same periods across years (e.g., Q2 2023 vs Q2 2024). Ideal for spotting seasonal trends.
- Month-over-Month (MoM): Useful for startups tracking rapid changes but volatile; best used with moving averages.
- Organic Growth Rate: Excludes growth from acquisitions, focusing on internal performance.
- EBITDA Growth: Measures operating profitability growth, less affected by financing or tax strategies.
No single metric tells the whole story. Combine multiple views for a complete picture.
Frequently Asked Questions
Can growth rate be negative?
Yes. A negative growth rate indicates decline. For example, if revenue drops from $1M to $900K over a year, the growth rate is -10%. This is common during economic downturns or restructuring phases.
How do I calculate quarterly growth rate?
Use the same CAGR formula but set n = number of quarters divided by 4. Alternatively, for a single quarter comparison, use: [(Q2 – Q1)/Q1] × 100. For annualized quarterly growth, apply: [(1 + quarterly rate)^4] – 1.
Is high growth always a good sign?
Not necessarily. Rapid growth can strain operations, lead to cash flow issues, or result from unsustainable practices like heavy discounting. Always pair growth rate with margin analysis and liquidity metrics.
Conclusion: Turn Numbers Into Strategy
Calculating a company’s growth rate is more than a mathematical exercise—it’s a gateway to smarter business decisions. By following a disciplined approach, validating inputs, and contextualizing results, you transform raw data into strategic insight. Whether you're evaluating your own business or assessing investment opportunities, precision in measurement leads to confidence in action.


 浙公网安备
33010002000092号
浙公网安备
33010002000092号 浙B2-20120091-4
Comments
No comments yet. Why don't you start the discussion?