
Understanding the structure behind any webpage can be invaluable—whether you're learning web development, troubleshooting layout issues, or simply curious about how websites work. On a Chromebook, accessing and interpreting page source is straightforward once you know where to look and what to do. Unlike traditional desktops, Chromebooks run on Chrome OS, which relies heavily on the Chrome browser. This makes built-in developer tools your primary gateway to viewing and analyzing HTML, CSS, and JavaScript code directly from any site.
This guide walks through everything you need to know: how to open page source efficiently, interpret key elements, avoid common pitfalls, and use this knowledge for real-world applications like debugging or education.
Step-by-Step Guide to Accessing Page Source
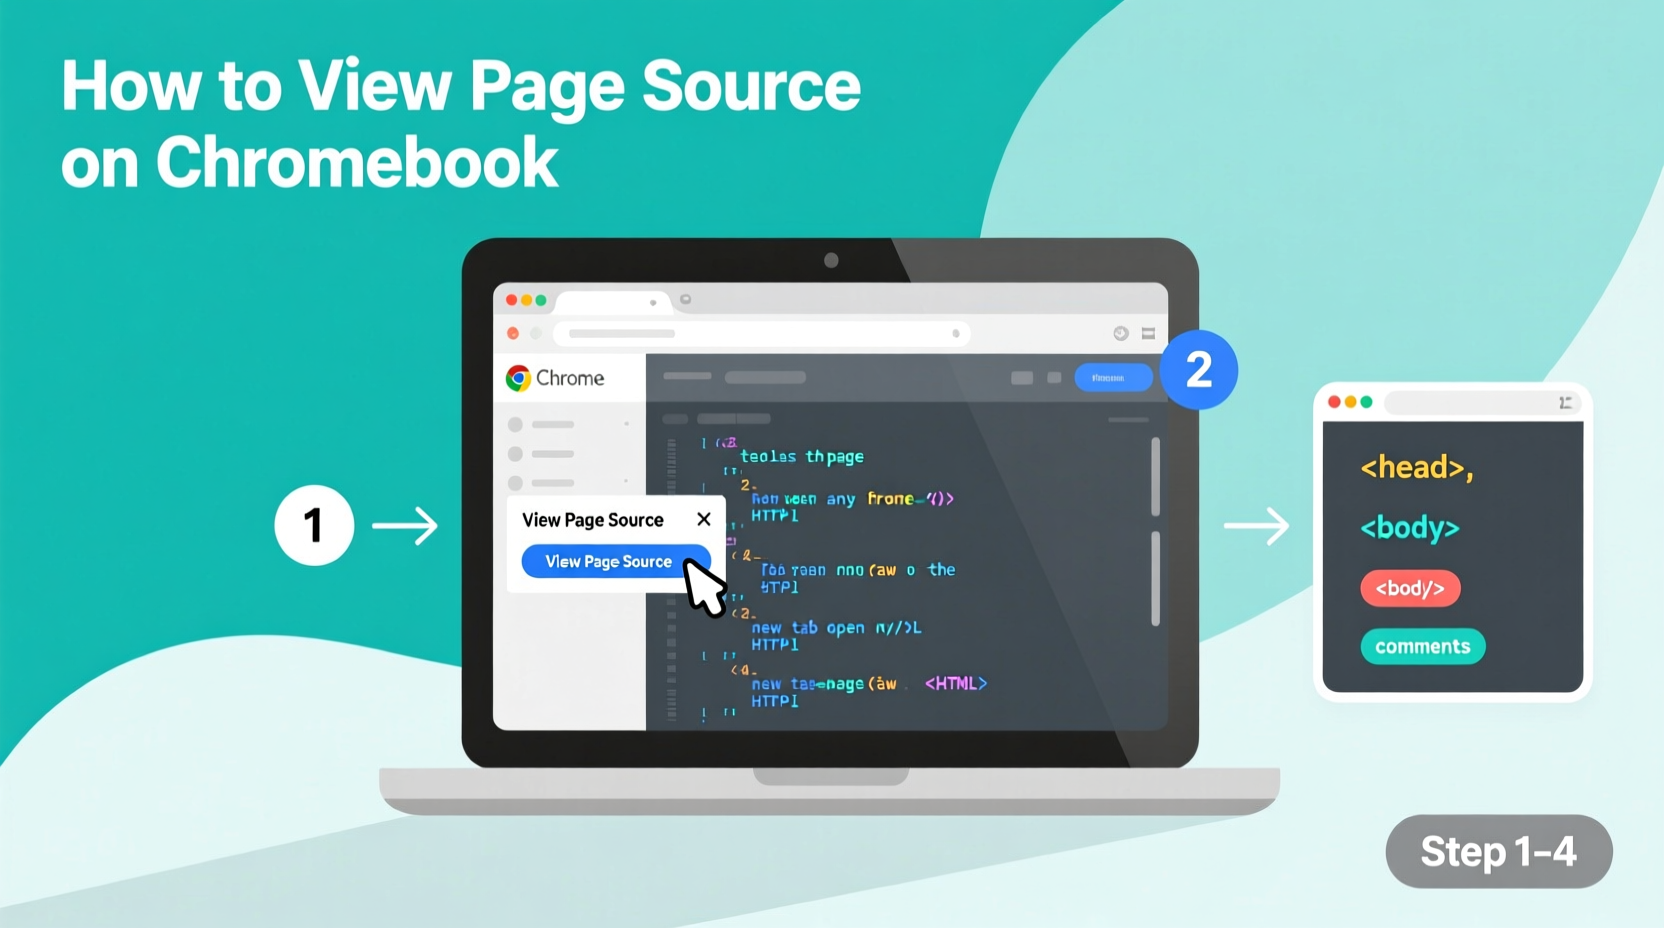
Accessing the page source on a Chromebook doesn’t require additional software. The Chrome browser includes all necessary tools, accessible via keyboard shortcuts or right-click context menus.
- Navigate to the webpage you want to inspect in the Chrome browser.
- Right-click anywhere on the page (except on interactive elements like buttons or forms that may trigger actions).
- Select \"Inspect\" from the context menu. This opens the Developer Tools panel at the bottom or side of your screen.
- Alternatively, press
Ctrl + Shift + Ito open Developer Tools directly. - To view raw HTML only, press
Ctrl + U. This shortcut loads a new tab displaying the full page source as plain text.
Ctrl + U when you only need to read the HTML structure quickly. For deeper analysis involving styles or scripts, always use \"Inspect\" mode.
Interpreting What You See in the Page Source
The raw page source shows the initial HTML sent by the server before dynamic content is loaded by JavaScript. While useful, it often differs from what appears visually on the page due to client-side rendering.
When using Developer Tools (Inspect), you’re seeing the live DOM—the Document Object Model—which reflects changes made after the page loads. This version includes modifications from JavaScript and user interactions.
- <head>: Contains metadata, title, links to CSS files, and script references.
- <body>: Holds visible content such as headings, paragraphs, images, and navigation menus.
- Class and ID attributes: Used for styling (CSS) and scripting (JavaScript). Identifying these helps locate specific sections.
- Inline vs. external resources: Look for
<link rel=\"stylesheet\">and<script src=\"\">tags pointing to external files.
For example, if you're trying to identify why a button isn't responding, check whether its associated JavaScript file has loaded properly under the Sources tab in Developer Tools.
Key Differences Between Raw Source and Live DOM
| Feature | Raw Page Source (Ctrl+U) |
Live DOM (Inspect) |
|---|---|---|
| Data Displayed | Original HTML from server | Current state including JS updates |
| Dynamic Content | Not visible (e.g., comments loaded via AJAX) | Fully rendered and editable |
| Best For | Quick HTML review, SEO checks | Debugging, design inspection |
| User Interaction Impact | No reflection of clicks or input | Updates in real time |
Practical Applications and Real-World Example
Understanding page source isn’t just for developers. Educators, students, and digital marketers can benefit too. Consider this scenario:
Mini Case Study: Fixing a Student’s Coding Project
A high school student building a personal portfolio website noticed that her navigation bar wasn’t aligning correctly on mobile devices. She accessed the page source on her Chromebook using Ctrl + Shift + I, navigated to the Elements tab, and inspected the navbar container. There, she discovered a missing viewport meta tag in the <head>:
<meta name=\"viewport\" content=\"width=device-width, initial-scale=1\">
After adding this line, the responsive layout worked instantly. Without understanding how to access and interpret the source, she might have spent hours guessing at design flaws instead of pinpointing the actual issue.
Expert Insight on Web Literacy
“Being able to read and understand page source is the foundation of modern digital literacy. It empowers users to move beyond passive consumption and start engaging critically with online content.” — Dr. Lena Patel, Digital Education Researcher, University of California
This perspective underscores why skills like viewing and interpreting HTML are increasingly essential—even outside technical careers. From identifying phishing attempts to evaluating website credibility, source inspection offers transparency in an opaque digital world.
Common Mistakes and Best Practices Checklist
Many users make simple errors when first exploring page source. Avoid these pitfalls with the following checklist:
✅ Page Source Inspection Checklist
- Use
Ctrl + Ufor static HTML review only. - Use
Ctrl + Shift + Ifor full debugging capabilities. - Check the Network tab to see if assets (CSS, JS, images) are failing to load.
- Don’t assume the raw source reflects current visuals—dynamic sites change after loading.
- Search within source using
Ctrl + Finside Developer Tools to find specific elements. - Avoid making permanent changes unless you control the website.
- Close Developer Tools when done to preserve system performance on lower-end Chromebooks.
Frequently Asked Questions
Can I edit the page source permanently from my Chromebook?
No. Changes made in Developer Tools are temporary and local to your browser session. To make lasting edits, you must modify the original website files—usually through an editor or CMS—and re-upload them to the server.
Why does the page look different from the source code?
Modern websites use JavaScript frameworks (like React or Vue.js) that generate content dynamically. The initial source may appear minimal because most elements are created after the page loads. Use the Elements tab in Developer Tools to see the live, updated DOM structure.
Is it safe to view page source on public Wi-Fi?
Yes. Viewing page source is a read-only action that doesn’t transmit sensitive data. However, avoid entering credentials or interacting with suspicious sites while connected to unsecured networks.
Conclusion: Take Control of Your Digital Experience
Accessing and understanding page source on a Chromebook unlocks deeper insight into how websites function. Whether you're troubleshooting a broken layout, studying web design principles, or verifying the integrity of online content, these skills put you in control. With just a few keystrokes, you transition from observer to investigator—equipped to explore, analyze, and learn from every site you visit.
Start small: next time you browse a favorite website, press Ctrl + Shift + I and explore one element. Over time, this habit builds confidence and competence in navigating the digital landscape. Technology should empower, not mystify. Mastering page source is a powerful step in that direction.


 浙公网安备
33010002000092号
浙公网安备
33010002000092号 浙B2-20120091-4
Comments
No comments yet. Why don't you start the discussion?