
Electrocardiogram (ECG) interpretation is a foundational skill in clinical medicine. Whether you're a medical student, nurse, or practicing clinician, the ability to accurately interpret an ECG can mean the difference between timely intervention and missed diagnosis. Despite its ubiquity, many find ECG analysis intimidating due to its combination of pattern recognition, measurement, and physiological understanding. This guide breaks down the process into clear, actionable steps, equipping you with the confidence to approach any tracing methodically and correctly.
Understanding the Basics: What an ECG Represents
An ECG records the electrical activity of the heart over time. Each wave and interval reflects specific phases of cardiac depolarization and repolarization. The standard 12-lead ECG provides views from multiple angles, allowing assessment of all major heart regions—left and right ventricles, atria, and interventricular septum.
The key components of a normal ECG include:
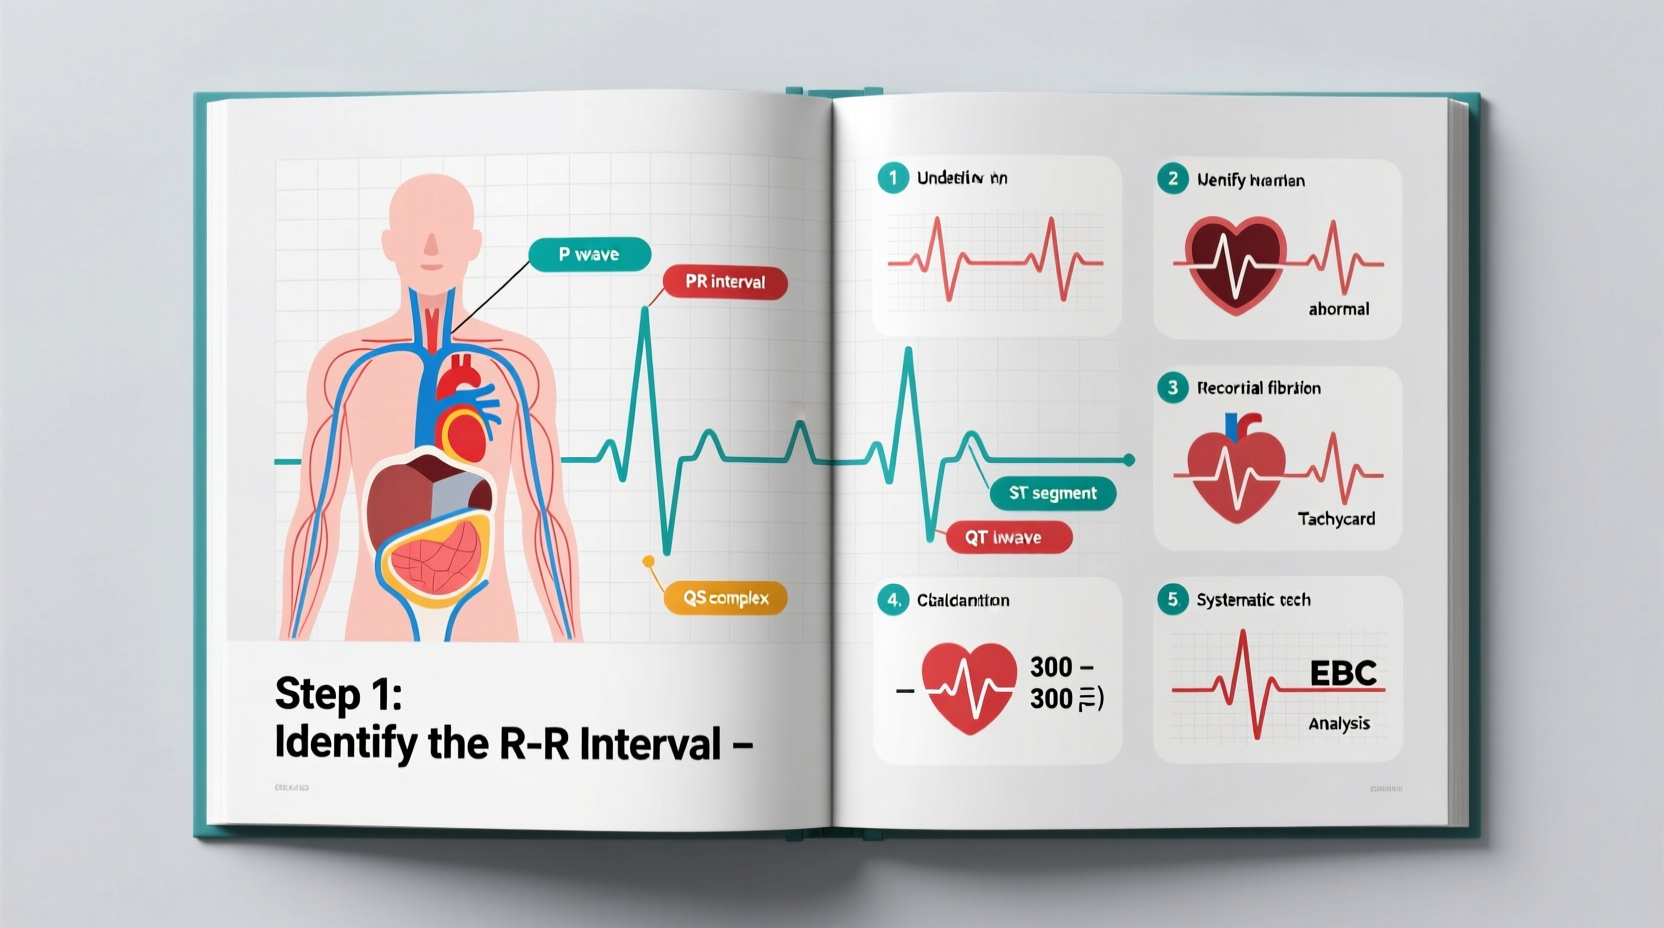
- P wave: Atrial depolarization
- PR interval: Time from onset of atrial to ventricular depolarization (normally 120–200 ms)
- QRS complex: Ventricular depolarization (duration <120 ms)
- ST segment: Early ventricular repolarization; should be isoelectric
- T wave: Main phase of ventricular repolarization
- QT interval: Total time for ventricular activity (corrected for heart rate as QTc)
Familiarity with these elements forms the foundation of accurate interpretation. Deviations may indicate arrhythmias, ischemia, electrolyte imbalances, or structural disease.
Step-by-Step Guide to Systematic ECG Analysis
Interpreting an ECG without a structured approach increases the risk of oversight. Follow this six-step framework consistently:
- Assess Rhythm: Determine if the rhythm is regular or irregular. Use calipers or paper markings to measure R-R intervals. Identify P waves and their relationship to QRS complexes to distinguish sinus rhythm from ectopic or junctional rhythms.
- Determine Heart Rate: For regular rhythms, divide 300 by the number of large squares between R waves. For irregular rhythms, count the number of QRS complexes in a 10-second strip and multiply by 6.
- Evaluate Axis: Check the QRS direction in leads I and aVF. Normal axis ranges from -30° to +90°. Left axis deviation suggests left anterior fascicular block or inferior MI; right axis deviation may indicate right ventricular strain or pulmonary disease.
- Measure Intervals: Assess PR, QRS, and QT intervals. Prolonged PR suggests AV block; widened QRS (>120 ms) indicates bundle branch block or ventricular origin; prolonged QT increases risk of torsades de pointes.
- Examine Segments and Waves: Look for ST elevation/depression, T wave inversion, or pathological Q waves. These changes can signal acute coronary syndrome, pericarditis, or chronic remodeling.
- Identify Any Abnormalities: Consider hypertrophy patterns (e.g., Sokolow-Lyon criteria for LVH), conduction blocks, arrhythmias, or drug effects (e.g., digoxin, amiodarone).
“Half of all critical ECG findings are initially missed due to lack of systematic review.” — Dr. Laura Bennett, Cardiologist and Medical Educator
Common Patterns and Their Clinical Significance
Certain ECG patterns recur frequently in clinical practice. Recognizing them early improves diagnostic speed and accuracy.
| Pattern | Key Features | Possible Causes |
|---|---|---|
| STEMI (ST-Elevation MI) | ST elevation ≥1 mm in two contiguous leads, new LBBB with symptoms | Occlusion of coronary artery; requires immediate reperfusion |
| Atrial Fibrillation | Irregularly irregular rhythm, no discernible P waves | Hypertension, valvular disease, hyperthyroidism, aging |
| Third-Degree AV Block | No relationship between P waves and QRS; independent atrial and ventricular rates | Ischemia, fibrosis, medication toxicity (e.g., beta-blockers) |
| Hyperkalemia | Peaked T waves, widened QRS, loss of P waves | Renal failure, medication side effects, acidosis |
| Right Bundle Branch Block (RBBB) | RSR’ in V1, wide S in I and V6 | Chronic lung disease, congenital heart defects, idiopathic conduction disease |
Mini Case Study: Identifying Acute Inferior MI
A 62-year-old male presents with sudden-onset chest pressure radiating to his back and nausea. His ECG shows ST elevation in leads II, III, and aVF, with reciprocal ST depression in aVL. There are no P waves preceding some QRS complexes, indicating possible AV block.
This pattern strongly suggests acute inferior myocardial infarction involving the right coronary artery. The involvement of inferior leads (II, III, aVF) and reciprocal changes in aVL confirm localization. Given the potential for right ventricular involvement, fluid resuscitation must be cautious until ruled out. Immediate activation of the cath lab is warranted.
Avoiding Common Interpretation Errors
Misinterpretation often stems from cognitive shortcuts rather than lack of knowledge. Here are frequent pitfalls and how to avoid them:
- Mistaking artifact for arrhythmia: Shivering, poor electrode contact, or external interference can mimic VT or AF. Examine all 12 leads—true arrhythmias will appear across multiple leads.
- Overlooking subtle ST changes: In early STEMIs, ST elevation may be minimal. Compare with prior ECGs when available and assess for dynamic changes.
- Ignoring clinical context: An ECG does not exist in isolation. A normal tracing in a high-risk patient with typical symptoms still warrants further investigation.
- Confusing U waves with T waves: Prominent U waves in hypokalemia can be mistaken for biphasic T waves. Look for low-amplitude deflections after the T wave.
Checklist: Essential Steps Before Finalizing Your ECG Read
- ✅ Confirm patient identity and date/time of recording
- ✅ Verify correct lead placement (especially limb leads)
- ✅ Assess technical quality (baseline wander, noise, filtering)
- ✅ Determine rhythm and rate systematically
- ✅ Measure intervals (PR, QRS, QT)
- ✅ Evaluate axis and chamber enlargement
- ✅ Identify ischemic, traumatic, or metabolic changes
- ✅ Correlate findings with patient history and symptoms
- ✅ Note comparison with prior tracings if available
- ✅ Document interpretation clearly and communicate urgent findings immediately
Frequently Asked Questions
Can a normal ECG rule out a heart attack?
No. Up to 50% of patients with acute coronary syndrome have non-diagnostic initial ECGs. Serial ECGs and biomarkers (like troponin) are essential in symptomatic individuals, even if the first ECG appears normal.
What causes a false diagnosis of left ventricular hypertrophy on ECG?
Several conditions mimic LVH patterns, including athletic heart syndrome, obesity, emphysema, and normal variant voltage in younger individuals. Criteria like Sokolow-Lyon have limited specificity; echocardiography remains the gold standard for confirmation.
How do I differentiate between ventricular tachycardia and SVT with aberrancy?
Look for absence of RS complexes in precordial leads, extreme axis deviation, or AV dissociation—these favor VT. Fusion or capture beats are diagnostic. When uncertain, assume VT, as mismanagement can be fatal.
Final Thoughts and Call to Action
Mastering ECG interpretation is not about memorizing every rare abnormality but developing a disciplined, repeatable method that minimizes errors and maximizes diagnostic yield. With deliberate practice, exposure to real cases, and continuous feedback, anyone can become proficient. The stakes are high—your next ECG could reveal a life-threatening condition hiding in plain sight.


 浙公网安备
33010002000092号
浙公网安备
33010002000092号 浙B2-20120091-4
Comments
No comments yet. Why don't you start the discussion?