
Data is only as useful as your ability to navigate it. In Microsoft Excel, one of the most powerful tools for organizing and analyzing information is the column filter. Whether you're managing sales reports, tracking inventory, or compiling survey results, mastering filters allows you to isolate relevant data quickly and make informed decisions. This guide walks through everything from enabling basic filters to applying advanced customizations that elevate your spreadsheet efficiency.
Understanding Excel Filters: The Foundation of Data Clarity
Excel filters let you display only the rows that meet specific criteria while temporarily hiding others. When applied to column headers, they provide drop-down menus with sorting and filtering options. Unlike sorting, which rearranges all data permanently, filtering is dynamic and non-destructive—ideal for exploratory analysis.
Filters work best on structured datasets where each column has a clear header and consistent data types (text, numbers, dates). They support multiple conditions across different columns, enabling complex queries without formulas. For example, you can filter a sales table to show only \"Q4\" entries with revenue over $10,000.
Step-by-Step Guide to Adding Filters in Excel
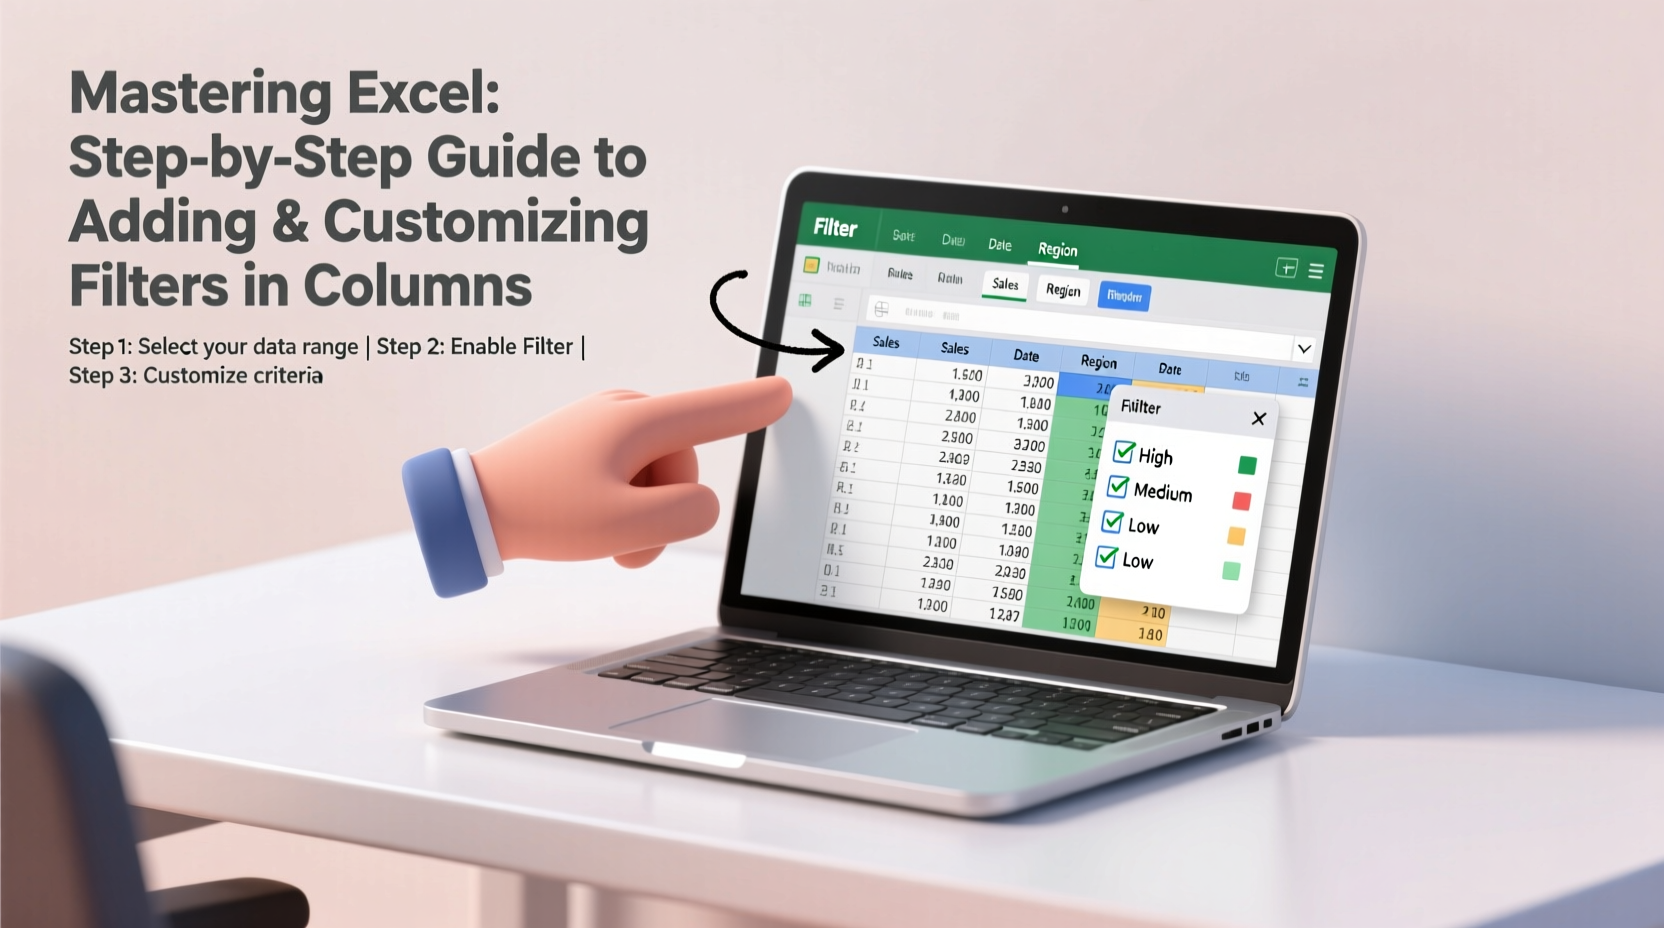
Applying filters is straightforward, but precision ensures optimal performance. Follow these steps to activate filtering across your dataset:
- Select any cell within your data range. Excel will automatically detect the boundaries if your data is contiguous.
- Navigate to the Data tab on the ribbon menu.
- Click the Filter button in the Sort & Filter group. Dropdown arrows will appear next to each column header.
- Click any dropdown arrow to access filtering options such as sorting (A to Z, Z to A) and value selection.
- To remove filters later, return to the Data tab and click Filter again to toggle them off.
Once enabled, clicking a column’s dropdown lets you uncheck “Select All” and choose specific values to display. For instance, in a customer list, you could filter by \"California\" under the State column to view only local clients.
Using Text, Number, and Date Filters
Excel automatically detects data type and adjusts filter options accordingly:
- Text Filters: Include options like \"Begins With,\" \"Contains,\" or \"Does Not Equal.\"
- Number Filters: Allow comparisons such as \"Greater Than,\" \"Between,\" or \"Top 10 Items.\"
- Date Filters: Offer presets like \"Today,\" \"This Week,\" \"Last Month,\" or custom date ranges.
These intelligent defaults save time when drilling into subsets of large datasets.
Customizing Filters for Advanced Data Control
Basic filtering scratches the surface. Customization unlocks deeper insights. Here's how to refine your approach:
Creating Custom Filter Conditions
For granular control, use the Number Filters or Text Filters submenu. Suppose you want to find employees whose salaries are between $50,000 and $75,000:
- Click the dropdown in the Salary column.
- Choose Number Filters > Between.
- Enter 50000 in the first field and 75000 in the second.
- Click OK. Only matching rows will be visible.
Similarly, text-based custom filters can identify names starting with \"S\" or email addresses containing \"@company.com\".
Filtering by Color or Icon Sets
If you’ve used conditional formatting to highlight key cells, Excel lets you filter by font color, cell color, or icon sets:
- In the column dropdown, scroll to Filter by Color.
- Select a specific color to show only rows with formatted cells of that shade.
This is particularly effective in dashboards where red indicates overdue tasks or green marks completed items.
Best Practices and Common Pitfalls
Even experienced users fall into traps that reduce filter effectiveness. Avoid these common mistakes:
| Do | Don't |
|---|---|
| Use unique, descriptive headers without special characters. | Leave blank rows or columns inside your data range. |
| Apply filters after removing duplicates. | Sort individual columns manually—always sort using the filter menu to maintain row integrity. |
| Leverage wildcards (* and ?) in text filters for partial matches. | Forget to clear filters before sharing files—hidden rows may mislead collaborators. |
“Filters are the gateway to self-service analytics in Excel. Users who master them spend less time searching and more time deciding.” — Dr. Alan Torres, Data Literacy Researcher at TechInsight Labs
Mini Case Study: Streamlining Monthly Reporting
Sarah, a regional operations manager at a logistics firm, previously spent hours each month manually extracting delivery statuses from a 10,000-row Excel sheet. After learning about multi-column filtering, she now applies two simultaneous filters: one for “Status = Late” and another for “Region = Northeast.” This reduces her reporting time from three hours to under 15 minutes. She also uses date filters to isolate last month’s data automatically, ensuring accuracy and consistency.
The change didn’t require new software—just better use of existing Excel features. Her team adopted the method company-wide after seeing the efficiency gains.
Frequently Asked Questions
Can I apply filters to only certain columns?
Yes. While the Filter command enables dropdowns on all headers in the selected range, you can leave some columns unfiltered by simply not interacting with their dropdowns. The functionality remains active but unused.
Why are my filter options grayed out?
This usually happens when Excel doesn’t recognize your selection as a valid data range. Check for merged cells, blank header rows, or unprotected worksheet restrictions. Also, ensure you’re not editing a cell when trying to apply filters.
How do I save filtered views for future use?
Excel doesn’t natively save filter states, but you can work around this by creating separate worksheets with preset filters or using Excel Tables with slicers. Alternatively, consider PivotTables for reusable report templates.
Checklist: Mastering Excel Filters
Use this checklist to ensure you're leveraging filters effectively:
- ✅ Confirm your data has headers and no internal blanks.
- ✅ Select a cell within the data range before enabling filters.
- ✅ Use the Data tab to toggle filters on/off.
- ✅ Apply multi-column filters to narrow down results precisely.
- ✅ Utilize custom filters for number ranges, text patterns, and dates.
- ✅ Filter by cell color or icons if using conditional formatting.
- ✅ Clear filters (Clear button in dropdown) before finalizing reports.
- ✅ Save filtered outputs as new sheets if needed for distribution.
Conclusion: Take Control of Your Data Today
Filters transform Excel from a static grid into an interactive analytical tool. By mastering how to add and customize them, you gain immediate access to meaningful subsets of your data without altering the original structure. These skills are foundational for anyone working with spreadsheets regularly—administrators, analysts, educators, and entrepreneurs alike.


 浙公网安备
33010002000092号
浙公网安备
33010002000092号 浙B2-20120091-4
Comments
No comments yet. Why don't you start the discussion?