
Understanding the t-statistic is essential for anyone working with small sample sizes or unknown population variances. Whether you're conducting academic research, analyzing business metrics, or interpreting clinical trial results, knowing how to calculate t correctly ensures your conclusions are statistically sound. This guide walks through the core concepts, formulas, and practical applications of the t-statistic, empowering you to perform accurate hypothesis tests and confidence interval estimations.
What Is the t-Statistic and Why It Matters
The t-statistic measures how many standard errors a sample mean is away from a hypothesized population mean. It’s central to the t-test, a method used when the population standard deviation is unknown and the sample size is small—typically less than 30. Unlike the z-score, which relies on known population parameters, the t-distribution accounts for additional uncertainty by having heavier tails, making it more conservative and reliable under real-world conditions.
Developed by William Sealy Gosset under the pseudonym \"Student\" while working at Guinness Brewery, the t-distribution revolutionized statistical inference in small samples. Today, it remains a cornerstone of inferential statistics across fields such as psychology, economics, medicine, and quality control.
“Without the t-distribution, much of modern experimental science would lack the tools to draw valid conclusions from limited data.” — Dr. Linda Zhao, Biostatistics Professor, University of Pennsylvania
Types of t-Tests and When to Use Them
There are three primary types of t-tests, each suited to different research questions:
- One-sample t-test: Compares the mean of a single sample to a known or hypothesized population mean.
- Independent (two-sample) t-test: Assesses whether the means of two independent groups differ significantly.
- Paired t-test: Evaluates the difference between two related measurements (e.g., before and after treatment) on the same subjects.
Selecting the correct test depends on your study design and data structure. Misapplication can lead to incorrect p-values and flawed interpretations.
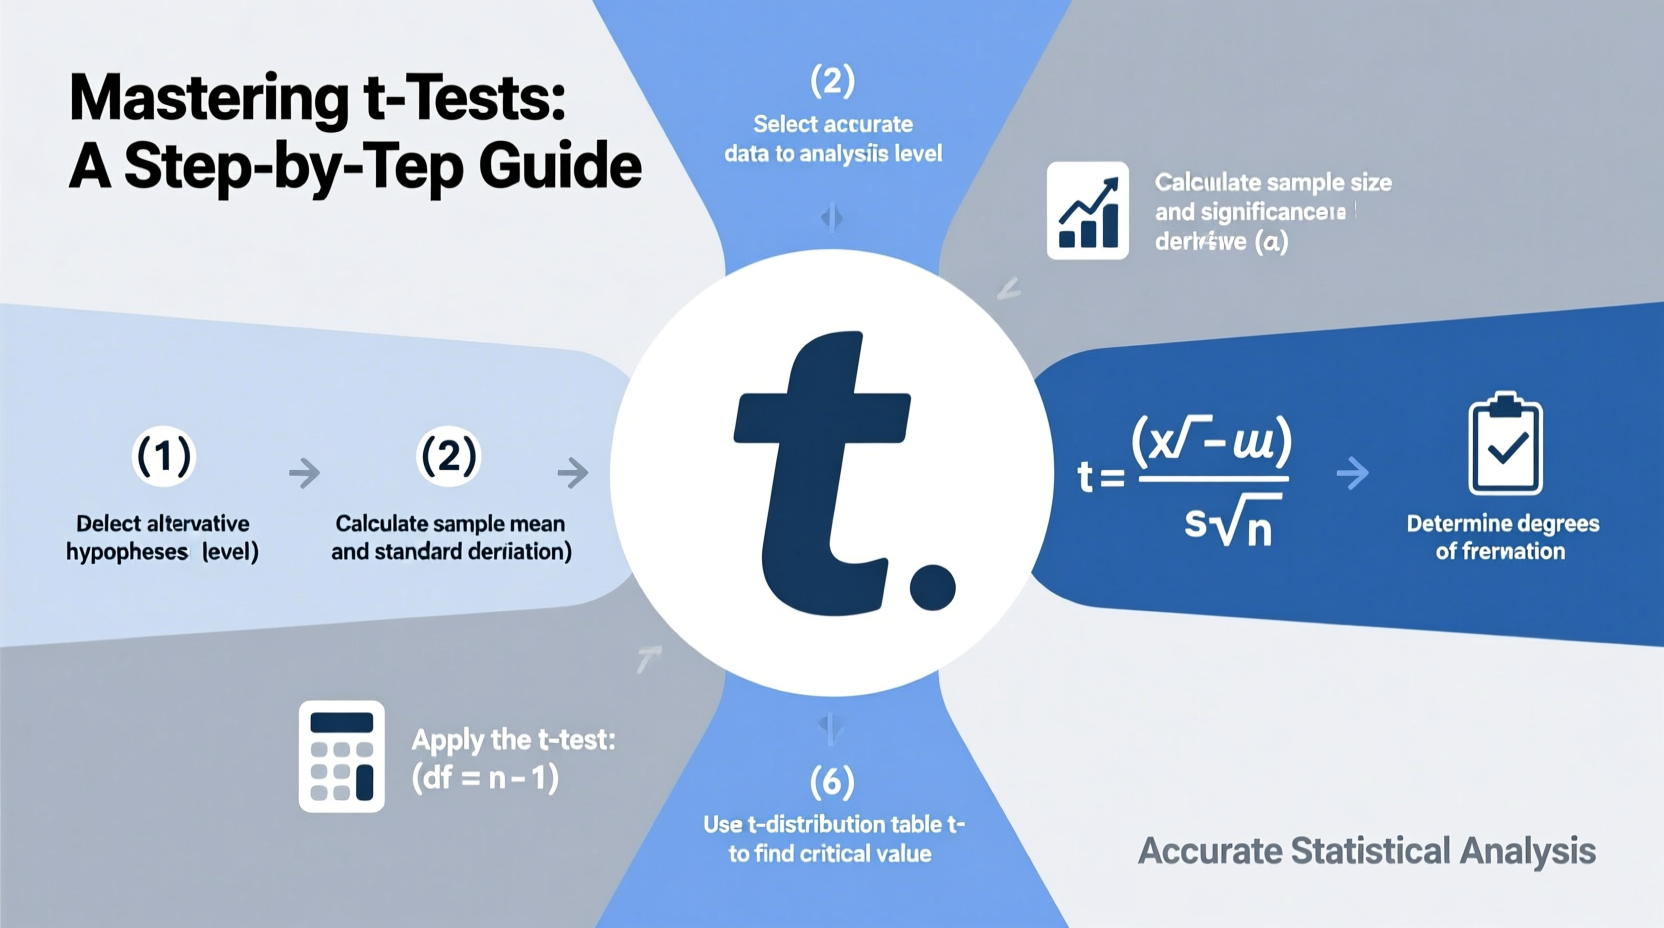
Step-by-Step Guide to Calculating t
Follow this structured process to compute the t-statistic accurately, regardless of test type.
- Define your hypothesis. State the null (H₀) and alternative (H₁) hypotheses clearly. For example, H₀: μ = 50 vs. H₁: μ ≠ 50.
- Choose the appropriate t-test based on your data structure and research question.
- Collect and summarize your data. Calculate sample mean(s), standard deviation(s), and sample size(s).
- Compute the t-statistic using the relevant formula.
- Determine degrees of freedom (df) and use a t-table or software to find the critical value or p-value.
- Make a decision: Reject or fail to reject the null hypothesis based on significance level (usually α = 0.05).
Example: One-Sample t-Test Calculation
A researcher wants to test if the average IQ of students in a gifted program exceeds 100. A sample of 25 students has a mean IQ of 107 with a standard deviation of 15.
Step 1: H₀: μ = 100; H₁: μ > 100 (one-tailed test)
Step 2: One-sample t-test
Step 3: x̄ = 107, s = 15, n = 25
Step 4: Compute t:
t = (x̄ – μ) / (s / √n) = (107 – 100) / (15 / √25) = 7 / 3 = 2.33
Step 5: df = n – 1 = 24. For α = 0.05 (one-tailed), critical t ≈ 1.711.
Step 6: Since 2.33 > 1.711, reject H₀. There is sufficient evidence that average IQ is above 100.
Key Formulas for Different t-Tests
| Test Type | Formula | Degrees of Freedom |
|---|---|---|
| One-Sample t | t = (x̄ – μ) / (s / √n) | n – 1 |
| Independent t (equal variances) | t = (x̄₁ – x̄₂) / √[s²(1/n₁ + 1/n₂)] | n₁ + n₂ – 2 |
| Paired t | t = d̄ / (s_d / √n) | n – 1 |
In the independent t-test formula, s² represents the pooled variance, calculated as:
s² = [(n₁–1)s₁² + (n₂–1)s₂²] / (n₁ + n₂ – 2)
Mini Case Study: Testing a New Teaching Method
A high school math department introduces a new interactive teaching method and wants to evaluate its impact. They select 20 students and measure their test scores before and after implementation.
Mean difference (after – before): d̄ = 8.2 points
Standard deviation of differences: s_d = 6.4
Sample size: n = 20
Using the paired t-test formula:
t = 8.2 / (6.4 / √20) = 8.2 / 1.43 ≈ 5.73
df = 19 → Critical t (α = 0.05, two-tailed) ≈ 2.093
Since 5.73 > 2.093, the improvement is statistically significant. The new method appears effective, warranting broader adoption.
Common Pitfalls and How to Avoid Them
Missteps in t-testing often stem from overlooked assumptions or misinterpretation of results. Here’s what to watch for:
- Assuming normality without checking: With small samples, severe skewness invalidates the test. Use histograms or Shapiro-Wilk tests to assess normality.
- Ignoring unequal variances: In independent t-tests, always run Levene’s test. If variances differ, use Welch’s t-test instead.
- Confusing statistical significance with practical importance: A tiny effect can be statistically significant with large samples. Report effect sizes (e.g., Cohen’s d) alongside p-values.
- P-hacking: Running multiple t-tests without correction inflates Type I error. Adjust alpha with Bonferroni or use ANOVA when comparing more than two groups.
“Statistical significance tells you whether an effect exists; effect size tells you whether it matters.” — Andrew Gelman, Professor of Statistics and Political Science
Checklist: Preparing for a Valid t-Test
- ☑ Define clear research question and hypotheses
- ☑ Choose the correct t-test type
- ☑ Verify data meets assumptions (normality, independence, equal variance)
- ☑ Calculate descriptive statistics (mean, SD, sample size)
- ☑ Apply the correct formula and determine df
- ☑ Compare t-value to critical value or compute p-value
- ☑ Interpret results in context, including effect size
Frequently Asked Questions
Can I use a t-test with non-normal data?
If your sample size is sufficiently large (typically n ≥ 30), the Central Limit Theorem allows the use of t-tests even with moderate non-normality. For smaller samples, consider non-parametric alternatives like the Wilcoxon signed-rank test.
What’s the difference between t and z-tests?
The z-test requires knowledge of the population standard deviation and is used for large samples. The t-test uses the sample standard deviation and is preferred when the population SD is unknown—common in real-world scenarios.
How do I report t-test results?
Use this format: t(df) = [value], p = [p-value]. Example: “Students scored higher after intervention, t(24) = 2.33, p = 0.028.” Include means, standard deviations, and effect size for full transparency.
Conclusion: Build Confidence Through Precision
Mastering how to calculate t in statistics transforms raw data into meaningful insights. By following structured procedures, validating assumptions, and interpreting results thoughtfully, you ensure your analyses stand up to scrutiny. Whether you’re a student, researcher, or analyst, proficiency in t-tests is a foundational skill that enhances credibility and decision-making power.


 浙公网安备
33010002000092号
浙公网安备
33010002000092号 浙B2-20120091-4
Comments
No comments yet. Why don't you start the discussion?