
Understanding the future value (FV) of an investment is essential for financial planning, whether you're saving for retirement, evaluating business returns, or comparing savings accounts. Microsoft Excel simplifies this process with its built-in FV function, allowing users to compute future values quickly and accurately. This guide walks through the mechanics of the FV function, explains each parameter, and provides real-world applications so you can confidently project your financial growth.
What Is Future Value and Why It Matters
Future value represents the amount an investment will grow to over time at a given interest rate. Unlike present value, which tells you what a future sum is worth today, future value answers: “How much will my money be worth in 5, 10, or 20 years?” This concept is foundational in personal finance, lending decisions, and long-term budgeting.
For example, if you invest $5,000 today at 6% annual interest compounded yearly, the future value after 10 years exceeds $8,950. Knowing this helps set realistic goals and assess whether your current savings strategy aligns with your objectives.
“Accurate future value calculations empower investors to make informed decisions about risk, return, and time horizon.” — Dr. Linda Park, Financial Modeling Instructor, University of Chicago
Understanding the FV Function Syntax in Excel
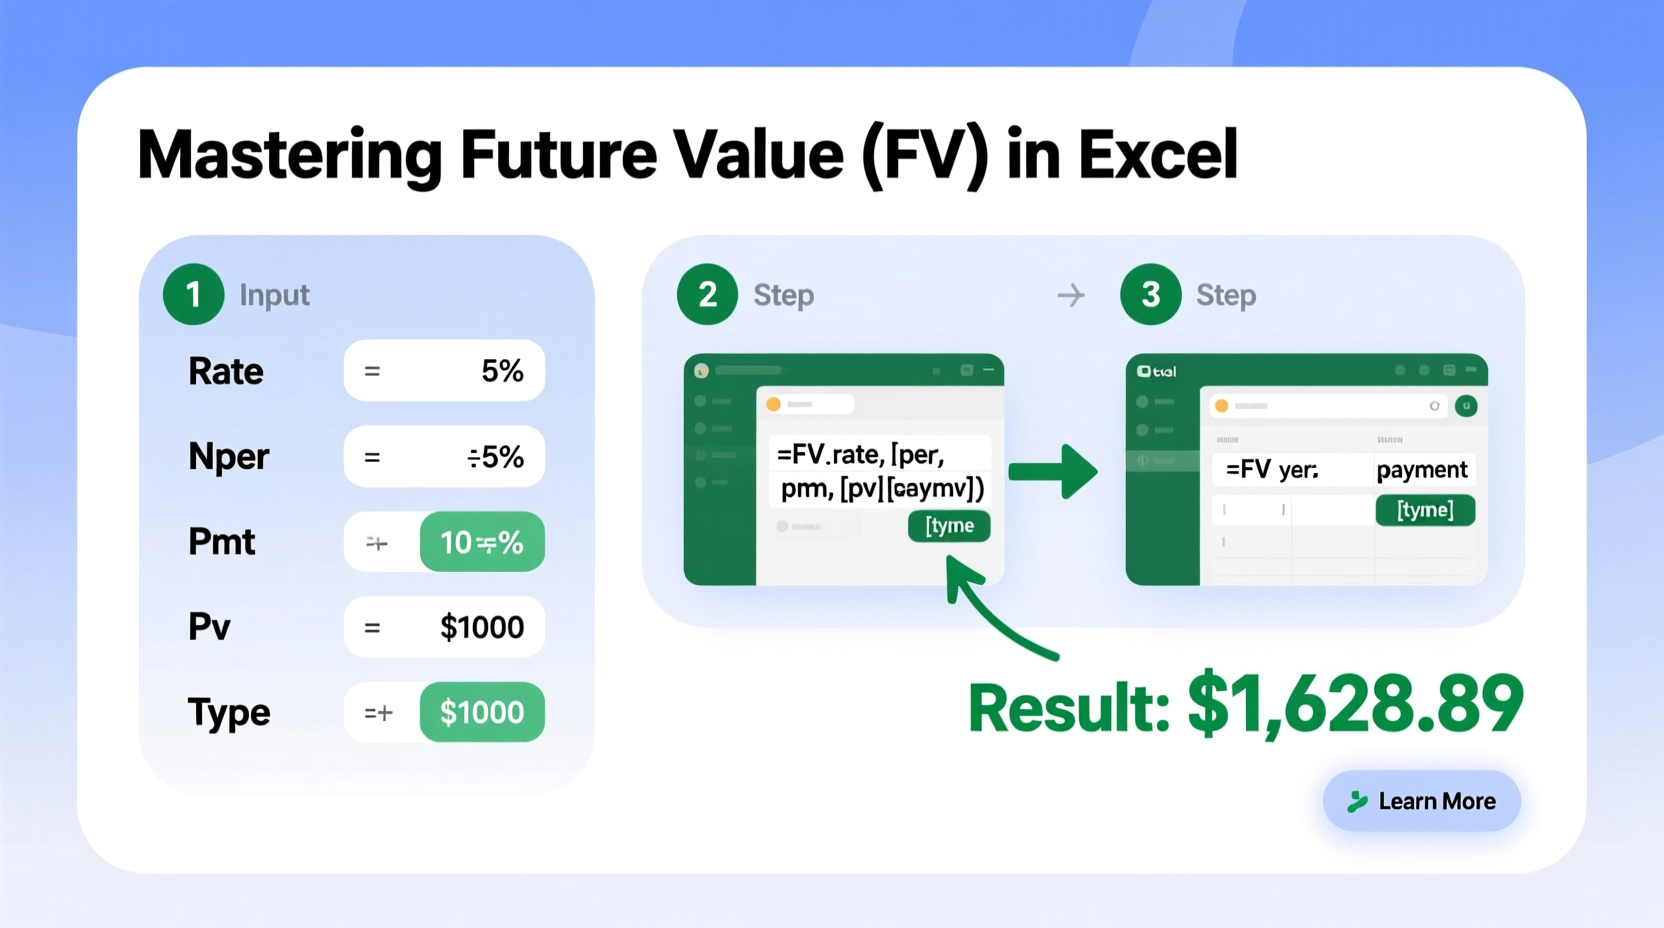
Excel’s FV function follows a precise syntax that incorporates key financial variables:
FV(rate, nper, pmt, [pv], [type])- rate: The interest rate per period (e.g., monthly, quarterly, annually).
- nper: Total number of payment periods.
- pmt: Payment made each period (enter as negative if it's an outflow).
- [pv]: Present value (optional; also entered as negative if it’s an initial investment).
- [type]: When payments are due (0 = end of period, 1 = beginning; optional, defaults to 0).
It's crucial to maintain consistency in time units. For instance, if using monthly compounding, divide the annual interest rate by 12 and multiply the number of years by 12.
Step-by-Step Guide to Calculate Future Value in Excel
Follow these steps to compute future value effectively:
- Open Excel and select a blank cell where you want the result displayed.
- Determine your inputs: Identify the interest rate, number of periods, payment amount, present value, and payment timing.
- Enter the FV formula. For example, to calculate the future value of a $1,000 initial deposit with $100 monthly contributions over 5 years at 5% annual interest compounded monthly:
=FV(5%/12, 5*12, -100, -1000, 0)5%/12→ Monthly interest rate5*12→ 60 total months-100→ Monthly contribution (outflow)-1000→ Initial investment (outflow)0→ Payments made at end of month
The result will show approximately $8,056.87, meaning your account will grow to this amount after five years.
Common Variations and Use Cases
| Scenario | Formula Example | Explanation |
|---|---|---|
| Lump-sum investment only | =FV(0.07, 10, 0, -5000) |
$5,000 invested once at 7% annual interest for 10 years. |
| Regular contributions only | =FV(0.06/12, 36, -200) |
$200 saved monthly for 3 years at 6% annual interest. |
| Combined lump sum + contributions | =FV(0.04/4, 20, -500, -2000, 1) |
Quarterly compounding: $2,000 initial + $500 paid at start of quarter for 5 years at 4%. |
Real-World Example: Planning for College Savings
Samantha wants to save for her newborn’s college education. She opens a 529 plan with an initial deposit of $2,500 and plans to contribute $150 monthly. Assuming an average annual return of 6%, compounded monthly, how much will she have when her child turns 18?
Using Excel:
=FV(6%/12, 18*12, -150, -2500, 0)The result is **$67,492.35**. This projection helps Samantha decide whether to increase her monthly contributions or explore higher-yield options to reach her target of $75,000.
Avoiding Common Mistakes with FV Calculations
Even small errors can lead to inaccurate projections. Here are frequent pitfalls and how to avoid them:
- Inconsistent time units: Mixing annual rates with monthly periods skews results. Always adjust rate and nper to match frequency.
- Incorrect cash flow signs: Entering investments as positive values reverses the output. Outflows should be negative.
- Ignoring compounding frequency: Not adjusting for monthly or quarterly compounding leads to underestimation.
- Overlooking inflation: FV gives nominal value. For real purchasing power, subtract expected inflation later.
“Most Excel errors in financial modeling come from mismatched time units or inconsistent cash flow signs. Double-check these first.” — Mark Reynolds, CFA and Corporate Finance Trainer
Do’s and Don’ts of Using the FV Function
| Do’s | Don’ts |
|---|---|
| Convert annual rates to periodic rates (e.g., /12 for monthly) | Use annual rate directly with monthly periods |
| Input payments and present values as negative numbers | Enter all values as positive and misinterpret results |
| Verify total number of periods (years × frequency) | Assume nper equals number of years regardless of compounding |
| Use cell references instead of hardcoding values | Embed numbers directly into formulas, making updates harder |
FAQ: Frequently Asked Questions About FV in Excel
Can I use the FV function for variable interest rates?
No, the standard FV function assumes a constant interest rate. For varying rates over time, use the FVSCHEDULE function, which applies a series of compound interest rates sequentially.
Why is my FV result negative?
This typically means you entered cash flows as positive values. In Excel’s financial functions, money paid out (investments or deposits) should be negative. Reverse the sign of pmt and pv inputs to fix this.
Does FV account for taxes or fees?
No. The FV function calculates pre-tax, fee-free growth. To model net returns, reduce the assumed rate of return by estimated tax and expense impacts (e.g., use 5% instead of 7% if 2% goes to fees and taxes).
Final Tips for Mastering FV in Excel
To become proficient with future value calculations:
- Create a reusable Excel template with labeled fields for rate, nper, pmt, and pv.
- Use Data Tables to run sensitivity analyses—see how changing interest rates or contributions affect outcomes.
- Pair FV with other functions like PMT, PV, or NPER for comprehensive financial planning.
- Label your worksheets clearly and add comments to explain assumptions.
Conclusion: Take Control of Your Financial Future
Mastering how to find FV in Excel transforms abstract financial goals into concrete, measurable targets. With just a few keystrokes, you can forecast savings growth, evaluate investment opportunities, and adjust strategies proactively. The FV function is more than a tool—it’s a gateway to smarter decision-making. Start applying these techniques today, build confidence in your financial models, and take meaningful steps toward long-term security.


 浙公网安备
33010002000092号
浙公网安备
33010002000092号 浙B2-20120091-4
Comments
No comments yet. Why don't you start the discussion?