
Understanding the variability within a dataset is fundamental in statistics. Variance measures how spread out the numbers in a sample are from the mean. For researchers, analysts, and students, mastering how to calculate sample variance is essential for drawing reliable conclusions from limited data. Unlike population variance, sample variance uses a correction factor (n−1) to account for bias when estimating from a subset of data. This guide walks through the complete process—step by step—with real-world examples, common pitfalls, and expert-backed methods to ensure accuracy.
Why Sample Variance Matters
When working with real-world data, it's often impractical or impossible to collect information from every member of a population. Instead, statisticians use samples to make inferences. However, sample data tends to underestimate true population variability because extreme values may be missing. To correct this, sample variance divides by (n−1), known as Bessel’s correction, providing an unbiased estimate.
This adjustment makes sample variance slightly larger than if divided by n, ensuring more accurate generalizations. Whether you're analyzing test scores, customer spending habits, or medical trial results, correctly calculating sample variance strengthens your analysis and supports sound decision-making.
“Sample variance is not just a formula—it’s a safeguard against overconfidence in small datasets.” — Dr. Lena Patel, Biostatistician at Johns Hopkins University
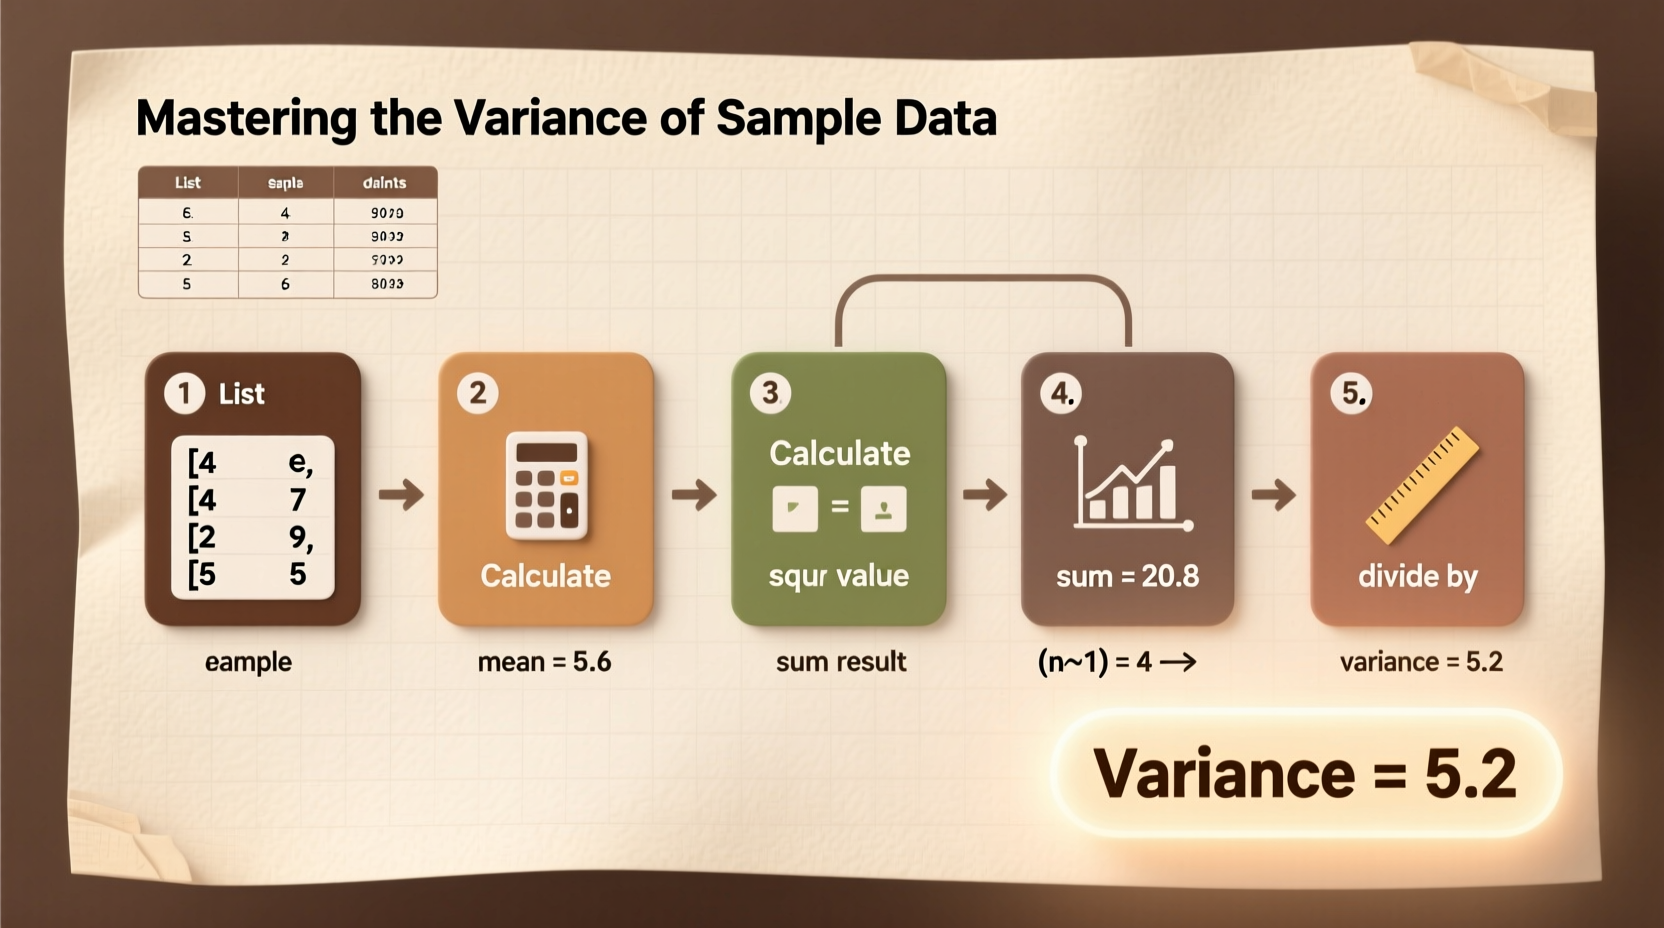
Step-by-Step Guide to Calculating Sample Variance
Follow these six steps to compute the sample variance manually. We’ll use a realistic example throughout: a teacher analyzing exam scores from a random sample of 6 students: 78, 85, 92, 67, 88, and 90.
- Find the sample mean (x̄)
Add all data points and divide by the number of observations (n).
Mean = (78 + 85 + 92 + 67 + 88 + 90) / 6 = 500 / 6 ≈ 83.33 - Subtract the mean from each data point
This gives you the deviation of each value from the average.
Deviations: 78 − 83.33 = −5.33 85 − 83.33 = 1.67 92 − 83.33 = 8.67 67 − 83.33 = −16.33 88 − 83.33 = 4.67 90 − 83.33 = 6.67 - Square each deviation
Squaring eliminates negative signs and emphasizes larger deviations.
Squared deviations: (−5.33)² ≈ 28.41 (1.67)² ≈ 2.79 (8.67)² ≈ 75.17 (−16.33)² ≈ 266.67 (4.67)² ≈ 21.81 (6.67)² ≈ 44.49 - Sum the squared deviations
Total = 28.41 + 2.79 + 75.17 + 266.67 + 21.81 + 44.49 ≈ 439.34 - Divide by (n − 1)
There are 6 data points, so n − 1 = 5.
Sample Variance (s²) = 439.34 / 5 ≈ 87.87 - Optional: Take square root for standard deviation
Standard Deviation (s) = √87.87 ≈ 9.37
Practical Example: Comparing Two Classes
A school administrator wants to compare the consistency of performance between two math classes using sample variance.
- Class A (Sample): 82, 84, 83, 85, 81
- Class B (Sample): 70, 95, 68, 98, 72
Class A Analysis:
Mean = (82+84+83+85+81)/5 = 83
Deviations: −1, 1, 0, 2, −2 → Squared: 1, 1, 0, 4, 4 → Sum = 10
Variance = 10 / (5−1) = 10 / 4 = 2.5
Class B Analysis:
Mean = (70+95+68+98+72)/5 = 80.6
Deviations: −10.6, 14.4, −12.6, 17.4, −8.6 → Squared: ~112.36, 207.36, 158.76, 302.76, 73.96 → Sum ≈ 855.2
Variance = 855.2 / 4 = 213.8
Despite similar averages, Class B has much higher variance, indicating inconsistent student performance. The teacher might investigate teaching strategies or offer targeted support. This demonstrates how variance reveals insights beyond averages.
Do’s and Don’ts When Calculating Sample Variance
| Do’s | Don’ts |
|---|---|
| Use (n−1) in the denominator for sample data | Use n instead of (n−1)—this underestimates variance |
| Round only at the final step to preserve accuracy | Round intermediate values like the mean too early |
| Verify calculations with software tools (e.g., Excel, R) | Assume calculator output is always correct without checking inputs |
| Label units clearly (variance is in squared units) | Mistake variance for standard deviation in interpretation |
| Check for outliers before computing | Include extreme outliers without investigating their cause |
Using Technology to Compute Sample Variance
While manual calculation builds understanding, real-world applications often rely on tools for speed and accuracy.
- Excel/Google Sheets: Use
=VAR.S(A1:A6)for sample variance. - Python (NumPy):
np.var(data, ddof=1)whereddof=1applies Bessel’s correction. - R:
var(data)automatically computes sample variance. - Calculator: Scientific calculators with STAT mode often have built-in variance functions labeled “s²”.
Always confirm which variance function you’re using—some systems default to population variance unless specified.
Frequently Asked Questions
What’s the difference between sample and population variance?
Sample variance uses (n−1) in the denominator to correct for bias when estimating from a subset. Population variance divides by N (total size) because it includes all data points. Using the wrong formula leads to inaccurate inferences.
Can variance be negative?
No. Because deviations are squared, all terms in the sum are non-negative. A variance of zero means all values are identical. Any variation produces a positive result.
Is high variance always bad?
Not necessarily. High variance indicates diversity or inconsistency. In investments, it signals risk; in creativity assessments, it may reflect diverse thinking. Context determines whether high variance is desirable or concerning.
Final Checklist: Mastering Sample Variance
- Checklist: Accurate Sample Variance Calculation
- ✅ Confirm you’re working with a sample, not a population
- ✅ Calculate the mean accurately
- ✅ Subtract mean from each value and square the result
- ✅ Sum all squared deviations
- ✅ Divide by (n−1), not n
- ✅ Label the result with appropriate units (e.g., points²)
- ✅ Cross-verify using software if possible
Conclusion: Turn Data Into Insight
Mastering how to find variance of sample data empowers you to move beyond surface-level summaries. It equips you to assess reliability, detect patterns, and communicate uncertainty effectively. Whether you're a student tackling homework, a researcher analyzing experiments, or a professional interpreting business metrics, precise variance calculation is a cornerstone of analytical rigor. Practice with real datasets, validate your work, and remember that behind every number is a story about variation in the real world.


 浙公网安备
33010002000092号
浙公网安备
33010002000092号 浙B2-20120091-4
Comments
No comments yet. Why don't you start the discussion?