
Absolute value equations are fundamental in algebra and appear frequently in real-world applications such as distance calculations, financial modeling, and signal processing. While the concept of absolute value—measuring distance from zero—is simple, graphing these equations can be challenging without a structured approach. Understanding how to visualize |x| transformations empowers students and professionals alike to interpret piecewise behavior, symmetry, and vertex shifts accurately.
This guide breaks down the process of graphing absolute value equations into manageable steps, offering practical techniques, common pitfalls, and real examples to solidify your understanding. Whether you're preparing for an exam or reinforcing foundational math skills, mastering this topic enhances both analytical thinking and graphical interpretation.
Understanding Absolute Value Basics
The absolute value of a number is its distance from zero on the number line, regardless of direction. Mathematically, it's defined as:
|x| = x if x ≥ 0
|x| = -x if x < 0
When applied to functions, the most basic absolute value equation is f(x) = |x|. Its graph forms a \"V\" shape with the vertex at the origin (0, 0), symmetric about the y-axis. The right side follows y = x, and the left side follows y = -x.
More complex equations modify this base shape through translations, stretches, compressions, and reflections. A general form of an absolute value function is:
f(x) = a|x - h| + k
- a: vertical stretch/compression and reflection (if a < 0)
- h: horizontal shift (vertex moves right if h > 0)
- k: vertical shift (vertex moves up if k > 0)
Recognizing each parameter’s role is essential before plotting any graph.
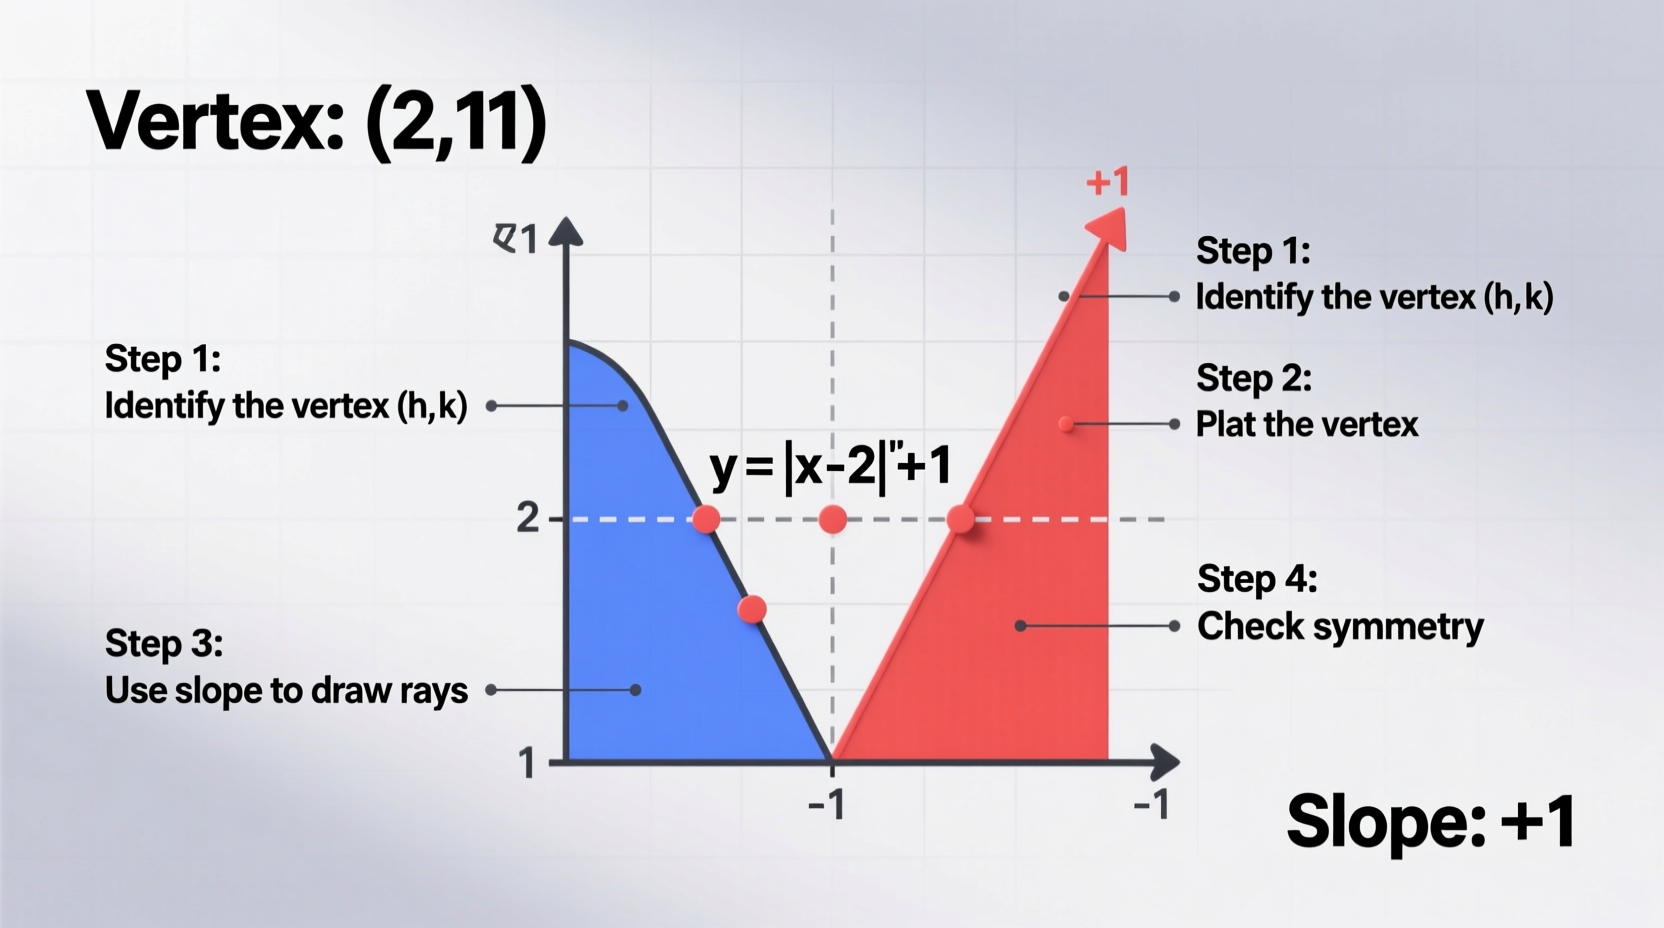
Step-by-Step Guide to Graphing Absolute Value Equations
Follow this systematic method to graph any absolute value equation accurately and efficiently.
- Rewrite the equation in standard form: Ensure the function is expressed as f(x) = a|x - h| + k. If not, isolate the absolute value expression and simplify.
- Determine the vertex: Extract h and k from the equation. The vertex is located at (h, k).
- Analyze the slope: The coefficient 'a' determines the steepness and direction of the arms. If a > 0, the V opens upward; if a < 0, it opens downward.
- Plot the vertex: Mark the point (h, k) on the coordinate plane.
- Use slope to find additional points: From the vertex, move right 1 unit and up |a| units (or down if a is negative). Repeat moving left 1 unit and apply the same vertical change due to symmetry.
- Skip unnecessary table work: Unlike quadratics, only two points beyond the vertex are typically needed because of linearity on each side.
- Draw the V-shaped graph: Connect the points with two straight rays meeting at the vertex.
Example: Graph f(x) = 2|x - 3| + 1
Step 1: Already in standard form.
Step 2: Vertex is (3, 1).
Step 3: a = 2 → steep upward V.
Step 4: Plot (3, 1).
Step 5: From vertex, go right 1 → up 2 → point (4, 3); go left 1 → up 2 → point (2, 3).
Step 6: Draw rays connecting (2,3) to (3,1) to (4,3).
This yields a narrow V centered at (3,1), steeper than the parent function due to the multiplier 2.
Common Transformations and Their Effects
Understanding how coefficients affect the graph allows for quick sketching without plotting multiple points. The table below summarizes key transformations:
| Transformation | Effect on Graph | Example |
|---|---|---|
| f(x) = |x - h| | Horizontal shift: right by h units | f(x) = |x - 4| → vertex at (4, 0) |
| f(x) = |x| + k | Vertical shift: up by k units | f(x) = |x| + 2 → vertex at (0, 2) |
| f(x) = a|x| where |a| > 1 | Vertical stretch: steeper V | a = 3 → slopes ±3 |
| f(x) = a|x| where 0 < |a| < 1 | Vertical compression: wider V | a = 0.5 → gentle slopes |
| f(x) = -|x| | Reflection over x-axis: opens downward | V shape inverted |
“Graphing absolute value functions isn’t about memorization—it’s about recognizing patterns. Once students see how each parameter alters the parent graph, they gain confidence and speed.” — Dr. Linda Reyes, Mathematics Education Specialist
Practical Tips and Common Mistakes
Even experienced learners make avoidable errors when graphing absolute values. Avoid these pitfalls with targeted strategies.
Do’s and Don’ts
| Do | Don't |
|---|---|
| Identify the vertex before doing anything else | Assume the vertex is at the origin |
| Check the sign of 'a' to determine opening direction | Forget that negative 'a' flips the V downward |
| Use symmetry to reduce calculation effort | Plot five or more arbitrary points unnecessarily |
| Simplify inside the absolute value first | Misread f(x) = |2x - 6| as having vertex at (6, 0) |
One frequent error occurs when the equation includes a coefficient inside the absolute value, such as f(x) = |2x - 6|. To find the vertex correctly, factor out the coefficient of x:
f(x) = |2(x - 3)| = 2|x - 3| → vertex still at (3, 0), but with vertical stretch.
Mini Case Study: Real-World Application in Delivery Pricing
A courier service uses an absolute value model to calculate delivery fees based on distance deviation from a central hub. Their pricing formula is:
C(d) = 1.5|d - 10| + 8
Where d is distance in miles from downtown, and C(d) is the cost in dollars. The base rate is $8 for deliveries exactly 10 miles away. For every mile under or over, the price increases by $1.50.
To visualize pricing trends, a logistics analyst graphs the function. The vertex is (10, 8), indicating minimum cost at 10 miles. With a = 1.5, the graph rises steadily in both directions. At 5 miles: C(5) = 1.5|5–10| + 8 = 15.5. At 15 miles: same cost due to symmetry.
This graph helps the company explain pricing fairness and forecast revenue across regions. It also reveals that costs grow linearly beyond the optimal zone, prompting route optimization strategies.
Frequently Asked Questions
Can an absolute value graph open sideways?
No—not when written as y = f(x). However, equations like x = |y| produce horizontal \"V\" shapes and are not functions since they fail the vertical line test. These require different graphing approaches and are often seen in conic sections or parametric forms.
How do I find the domain and range?
The domain of all absolute value functions in the form f(x) = a|x - h| + k is all real numbers (−∞, ∞), since you can input any x. The range depends on orientation:
- If a > 0: range is [k, ∞)
- If a < 0: range is (−∞, k]
What if there are multiple absolute values?
Equations like f(x) = |x - 1| + |x + 2| require piecewise analysis. Identify critical points where each expression equals zero (here, x = 1 and x = -2), then define intervals: (−∞, -2), [-2, 1), [1, ∞). In each interval, determine the sign inside each absolute value and rewrite accordingly. This creates a piecewise linear graph with possible corners at breakpoints.
Final Checklist for Accurate Graphing
Before finalizing your graph, run through this checklist:
- ✅ Is the equation in the form f(x) = a|x - h| + k?
- ✅ Did I correctly identify the vertex (h, k)?
- ✅ Does the sign of 'a' match the opening direction?
- ✅ Are the slopes consistent with |a| on both sides?
- ✅ Have I labeled key points: vertex, intercepts, and one point on each arm?
- ✅ Does the graph reflect symmetry about the vertical line x = h?
Conclusion and Call to Action
Graphing absolute value equations becomes intuitive once you internalize the structure of the parent function and how parameters transform it. Mastery comes not from rote repetition, but from understanding why each change affects the graph the way it does. By applying the step-by-step method, avoiding common errors, and practicing with real scenarios, you build both fluency and confidence.
Now that you have the tools, try graphing variations like f(x) = -0.5|x + 4| - 2 or modeling a situation involving tolerance ranges or deviation penalties. Share your graphs or challenges in the comments—let’s grow our mathematical insight together.


 浙公网安备
33010002000092号
浙公网安备
33010002000092号 浙B2-20120091-4
Comments
No comments yet. Why don't you start the discussion?