
Linear interpolation is one of the most fundamental tools in mathematics, computer graphics, engineering, and data science. It allows us to estimate unknown values between two known data points using a straight-line approximation. Despite its simplicity, mastering linear interpolation unlocks powerful capabilities—from animating smooth motion in games to filling gaps in datasets. This guide breaks down the concept into intuitive steps, demonstrates practical applications, and equips you with the confidence to use it effectively.
Understanding the Core Concept
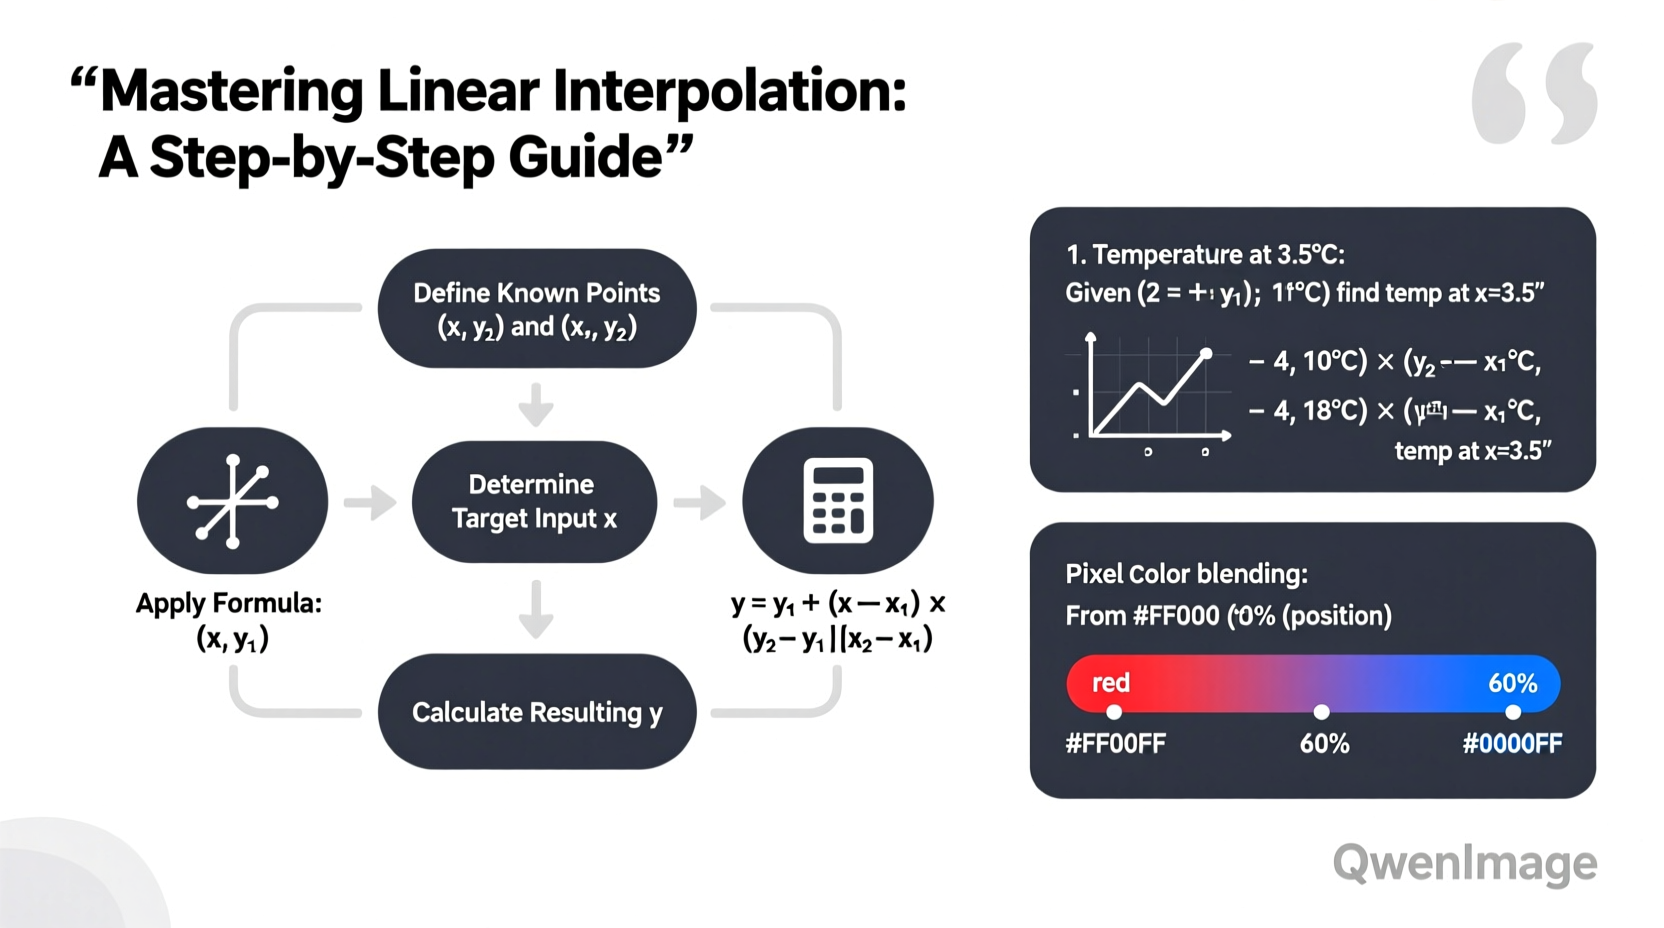
At its heart, linear interpolation estimates a value along a straight line between two known points. Given two endpoints—(x₀, y₀) and (x₁, y₁)—we can find the value of y at any intermediate x where x₀ ≤ x ≤ x₁. The underlying assumption is that the relationship between x and y is approximately linear within that interval.
The formula for linear interpolation is:
y = y₀ + (x − x₀) × [(y₁ − y₀) / (x₁ − x₀)]
This equation calculates how far x lies between x₀ and x₁ (as a fraction), then applies that same fraction to the difference in y-values. The result is a proportional estimate based on position.
Step-by-Step Guide to Performing Linear Interpolation
- Identify the known points. Determine (x₀, y₀) and (x₁, y₁) from your dataset or problem context.
- Define the target x-value. Choose the point x at which you want to estimate y.
- Check bounds. Ensure x lies between x₀ and x₁ to avoid extrapolation errors.
- Compute the interpolation factor (t). Use t = (x − x₀) / (x₁ − x₀). This represents the relative distance from x₀ to x₁.
- Apply the formula. Multiply t by the difference in y-values and add to y₀: y = y₀ + t × (y₁ − y₀).
- Validate the result. Ask whether the output makes sense given the context and scale.
Let’s walk through an example. Suppose you’re tracking temperature changes: at 2 PM, it was 25°C; at 4 PM, it rose to 31°C. What was the temperature at 3 PM?
- x₀ = 2, y₀ = 25
- x₁ = 4, y₁ = 31
- x = 3
t = (3 − 2) / (4 − 2) = 0.5
y = 25 + 0.5 × (31 − 25) = 25 + 3 = 28°C
The estimated temperature at 3 PM is 28°C—a reasonable midpoint given the steady increase.
Practical Applications Across Fields
Linear interpolation isn’t just theoretical—it powers decisions and designs across industries.
Data Science and Missing Values
In time-series datasets, sensors may fail or records get corrupted. Instead of discarding incomplete entries, analysts often interpolate missing values. For instance, if a fitness tracker skips a heart rate reading at 10:03 AM but has data at 10:00 and 10:06, linear interpolation provides a plausible estimate.
Computer Graphics and Animation
Game engines and UI frameworks use interpolation (often called “lerp”) to create smooth transitions. When moving an object from position A to B over time, each frame computes an interpolated coordinate. This avoids jerky motion and enhances visual fluidity.
Engineering and Calibration
Sensors are frequently calibrated at discrete intervals. To interpret readings between calibration points, engineers apply linear interpolation. A pressure sensor tested at 10 bar and 20 bar can still give usable outputs at 15 bar using this method.
“Interpolation bridges the gap between measurement and meaning. In signal processing, even basic linear methods save hours of manual estimation.” — Dr. Lena Torres, Signal Analysis Researcher
Common Pitfalls and Best Practices
While straightforward, linear interpolation can mislead if applied carelessly. Below is a comparison of recommended practices versus common mistakes.
| Do’s | Don’ts |
|---|---|
| Verify linearity in the region before interpolating | Assume all relationships are linear without checking |
| Use interpolation only within the range of known data | Extrapolate beyond endpoints using the same formula |
| Round results appropriately based on measurement precision | Pretend interpolated values have the same accuracy as real measurements |
| Document when and why interpolation was used | Treat interpolated data as raw observational data |
Mini Case Study: Filling Gaps in Sales Data
A retail analyst is reviewing monthly sales figures. March shows $42,000 in revenue, and May shows $54,000, but April’s data is missing due to a system error. Management needs a reasonable estimate for quarterly reporting.
Using linear interpolation:
- x₀ = 3 (March), y₀ = 42,000
- x₁ = 5 (May), y₁ = 54,000
- x = 4 (April)
t = (4 − 3) / (5 − 3) = 0.5
y = 42,000 + 0.5 × (54,000 − 42,000) = 42,000 + 6,000 = 48,000
The analyst reports an estimated $48,000 for April. While not exact, it aligns with a steady growth pattern and supports accurate quarterly totals. The team notes the figure as interpolated in their presentation.
Implementation in Code
Most programming languages support linear interpolation either natively or via libraries. Here’s how to implement it in Python:
def lerp(x, x0, y0, x1, y1):
    if x1 == x0:
        raise ValueError(\"x0 and x1 must be different\")
    t = (x - x0) / (x1 - x0)
    return y0 + t * (y1 - y0)

# Example usage
april_sales = lerp(4, 3, 42000, 5, 54000)
print(f\"Estimated April sales: ${april_sales:,.2f}\")
Output: Estimated April sales: $48,000.00
In JavaScript, it's equally concise:
function lerp(x, x0, y0, x1, y1) {
    const t = (x - x0) / (x1 - x0);
    return y0 + t * (y1 - y0);
}
console.log(lerp(3, 2, 25, 4, 31)); // Output: 28
Frequently Asked Questions
Can linear interpolation be used for non-numeric data?
No, linear interpolation requires numeric inputs and assumes a continuous, ordered domain. For categorical or symbolic data, other imputation techniques like mode-filling or predictive modeling are more appropriate.
What’s the difference between interpolation and extrapolation?
Interpolation estimates values within the range of known data points. Extrapolation predicts values outside that range. While interpolation is generally reliable under linearity assumptions, extrapolation carries higher risk because trends may change beyond observed limits.
Is linear interpolation always the best choice?
Not always. For rapidly changing or nonlinear systems—like stock prices or biological growth curves—higher-order methods such as spline interpolation or regression models may yield better accuracy. However, linear interpolation remains ideal for simplicity, speed, and transparency when trends are stable.
Essential Checklist for Reliable Results
- Confirm both x and y values are numeric and correctly paired
- Ensure the target x falls within the interval [x₀, x₁]
- Plot the points visually if possible to assess linearity
- Double-check division operations to avoid divide-by-zero errors
- Document interpolated values in final outputs
- Test edge cases (e.g., x = x₀ or x = x₁) to ensure correct behavior
Moving Beyond the Basics
Once comfortable with one-dimensional linear interpolation, you can extend the concept. Bilinear interpolation estimates values on a 2D grid, commonly used in image resizing. Trilinear interpolation extends this to 3D volumes, critical in medical imaging and 3D rendering.
You might also explore easing functions in animation, where modified interpolation (e.g., ease-in-out) creates natural motion by varying the interpolation factor over time. These build directly on the foundational lerp function.
Conclusion
Linear interpolation is deceptively simple but profoundly useful. Whether you're cleaning data, designing animations, or solving engineering problems, the ability to estimate intermediate values reliably is indispensable. By understanding the formula, recognizing its limitations, and applying it thoughtfully, you turn sparse information into actionable insights.


 浙公网安备
33010002000092号
浙公网安备
33010002000092号 浙B2-20120091-4
Comments
No comments yet. Why don't you start the discussion?