
Understanding how values change over time is essential in finance, sales, project management, and data analysis. One of the most powerful tools for measuring such changes is the percentage difference. In Excel, calculating this metric accurately can reveal trends, support decision-making, and improve reporting clarity. Yet many users apply the wrong formula or misinterpret results, leading to flawed conclusions. This guide walks through the correct methodology, practical applications, and expert tips to ensure your percentage difference calculations are both precise and meaningful.
What Is Percentage Difference and Why It Matters
Percentage difference measures the relative change between two values—typically an original (old) value and a new value. Unlike absolute difference, which only shows numerical variance, percentage difference expresses that change as a proportion of the original value. This makes it easier to compare changes across datasets with different scales.
For example, a $10 increase on a $50 item represents a 20% rise, while the same $10 increase on a $200 item is just 5%. Without percentages, these differences appear equal, masking their true impact.
The standard formula used in Excel is:
(New Value – Old Value) / Old Value * 100
This returns the percentage change from the old to the new value. A positive result indicates growth; a negative one reflects decline.
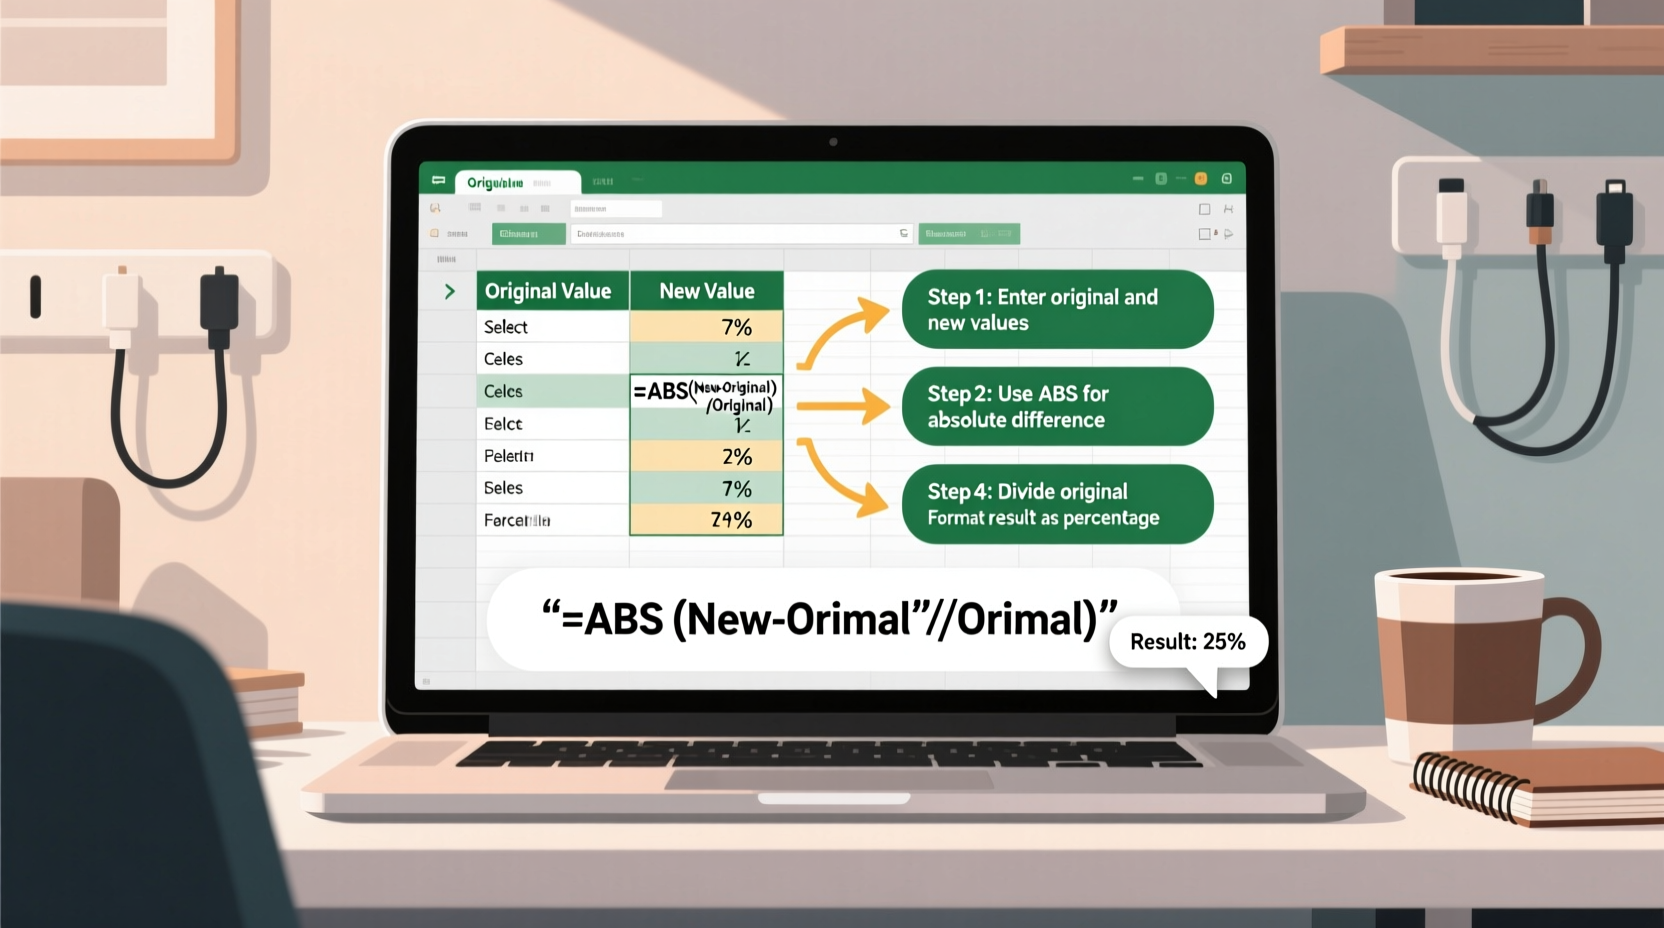
Step-by-Step Guide to Calculating Percentage Difference in Excel
Follow this sequence to compute percentage difference correctly in any Excel worksheet.
- Organize Your Data: Place the old and new values in adjacent columns. For instance, column A for last month’s sales and column B for this month’s.
- Select the Output Cell: Click on the cell where you want the percentage result (e.g., C2).
- Enter the Formula: Type
=(B2-A2)/A2. Do not multiply by 100 manually—Excel handles percentage formatting automatically. - Format as Percentage: Right-click the cell, choose “Format Cells,” then select “Percentage” with desired decimal places (usually 1 or 2).
- Drag the Formula Down: Use the fill handle to apply the formula to all relevant rows.
- Review Results: Check for anomalies like extremely high percentages or divide-by-zero errors.
If the old value is zero, the formula fails because division by zero is undefined. In such cases, consider using conditional logic to handle exceptions.
Handling Zero or Missing Values
To prevent #DIV/0! errors when the old value is zero, wrap the formula with an IF statement:
=IF(A2=0, \"N/A\", (B2-A2)/A2)
This displays “N/A” instead of an error, improving readability in reports.
Common Mistakes and How to Avoid Them
Even experienced Excel users make subtle errors when calculating percentage differences. Recognizing these pitfalls ensures accuracy and credibility in your analyses.
| Mistake | Why It's Wrong | Correct Approach |
|---|---|---|
| Using average of two values in denominator | Confuses percentage difference with percentage change; distorts scale | Stick to (New - Old)/Old unless specifically calculating symmetric percentage difference |
| Forgetting to format as percentage | Results show decimals (e.g., 0.15 instead of 15%) | Apply percentage format via Home tab or Format Cells dialog |
| Reversing old and new values | Inverts direction of change (growth appears as decline) | Double-check data order before applying formula |
| Not handling zero denominators | Causes #DIV/0! errors that disrupt dashboards | Use IF or IFERROR to manage edge cases gracefully |
“Accuracy in percentage calculation isn’t just about math—it’s about context. Mislabeling growth as decline due to a simple sign error can lead to poor business decisions.” — Dr. Lena Patel, Data Integrity Consultant
Real-World Application: Sales Performance Analysis
A regional retail manager needs to evaluate monthly performance across five stores. Last month (April), Store 1 reported $42,000 in sales. This month (May), it earned $48,300. What’s the percentage difference?
Using the formula:
- New Value = 48,300
- Old Value = 42,000
- Difference = (48,300 – 42,000) / 42,000 = 0.15
Formatted as a percentage: **15% increase**.
The manager repeats this for all stores and discovers that while overall revenue grew, Store 3 declined by 8.7%. This prompts a deeper investigation into staffing and inventory levels at that location. Without percentage-based comparison, such underperformance might have been overlooked amid general growth.
Advanced Techniques for Better Insights
Once comfortable with basic percentage difference, enhance your spreadsheets with these advanced methods.
Conditional Formatting for Visual Impact
Highlight positive changes in green and negative ones in red:
- Select the percentage column.
- Go to Home → Conditional Formatting → New Rule.
- Choose “Format only cells that contain.”
- Set: “Cell Value” > 0 → Format with green fill.
- Add another rule: “Cell Value” < 0 → Format with red fill.
Using Named Ranges for Clarity
Instead of referencing cells like A2 and B2, define named ranges:
- Select cell A2, go to Formulas → Define Name → Enter “Last_Sales”.
- Repeat for B2 as “Current_Sales”.
- Use formula:
=(Current_Sales - Last_Sales) / Last_Sales
This improves formula readability, especially in complex models.
Dynamic Dashboard Integration
Link your percentage difference results to charts or summary boxes. For instance, use a cell showing the average % change across departments as a KPI card in a dashboard.
FAQ: Common Questions About Percentage Difference in Excel
Can I calculate percentage difference for negative numbers?
Yes, but interpret results carefully. For example, going from -10 to +5 yields a 150% increase: (5 - (-10)) / (-10) = 15 / -10 = -1.5 → -150%. The negative sign here indicates movement toward positivity, which may be counterintuitive. Consider explaining context in reports.
What’s the difference between percentage difference and percentage change?
In practice, they’re often used interchangeably. Technically, “percentage change” refers to directional change (positive/negative), while “percentage difference” sometimes implies absolute difference relative to average (used in science). In business contexts, (New – Old)/Old is standard and called percentage change.
How do I calculate year-over-year percentage difference?
Same formula applies. Ensure your “old” value is from the same period last year. For example, May 2023 vs. May 2024. Use Excel functions like VLOOKUP or XLOOKUP to pull historical data automatically if working with large datasets.
Final Checklist: Ensuring Accuracy in Every Calculation
- ✅ Confirm the correct order: new value minus old value
- ✅ Format output cells as percentages with appropriate decimal precision
- ✅ Handle zero or blank denominators using IF or IFERROR
- ✅ Double-check formulas after copying across rows
- ✅ Label results clearly (e.g., “% Change”, not just “Delta”)
- ✅ Validate with manual spot checks on random entries
- ✅ Use consistent date or period references when comparing over time
Conclusion: Turn Data Into Decisions
Mastering percentage difference in Excel transforms raw numbers into actionable insights. Whether you're tracking financial growth, monitoring project progress, or evaluating marketing campaigns, accurate percentage calculations provide the clarity needed to make informed choices. By following the steps outlined here—applying correct formulas, avoiding common traps, and enhancing presentation—you’ll not only improve your spreadsheets but also strengthen your analytical credibility.


 浙公网安备
33010002000092号
浙公网安备
33010002000092号 浙B2-20120091-4
Comments
No comments yet. Why don't you start the discussion?