
Understanding probability is more than just a mathematical skill—it’s a practical tool for making informed decisions in everyday life, from assessing risks in finance to predicting outcomes in sports or healthcare. While the concept may seem intimidating at first, breaking it down into manageable steps reveals a logical system that anyone can learn. This guide walks through the fundamentals of calculating probability percentages with clarity, precision, and real-world relevance.
What Probability Really Means
At its core, probability measures how likely an event is to occur. It’s expressed as a number between 0 and 1, where 0 means impossibility and 1 indicates certainty. When converted to a percentage, this value becomes more intuitive—multiplying the decimal result by 100 gives you the likelihood in familiar terms (e.g., 0.75 = 75%).
For example, if you flip a fair coin, there are two possible outcomes: heads or tails. The chance of getting heads is 1 out of 2, which translates to:
(1 ÷ 2) × 100 = 50%
This simple framework applies across countless scenarios, but accuracy depends on correctly identifying all possible outcomes and understanding the conditions under which events occur.
The Step-by-Step Framework for Accurate Calculations
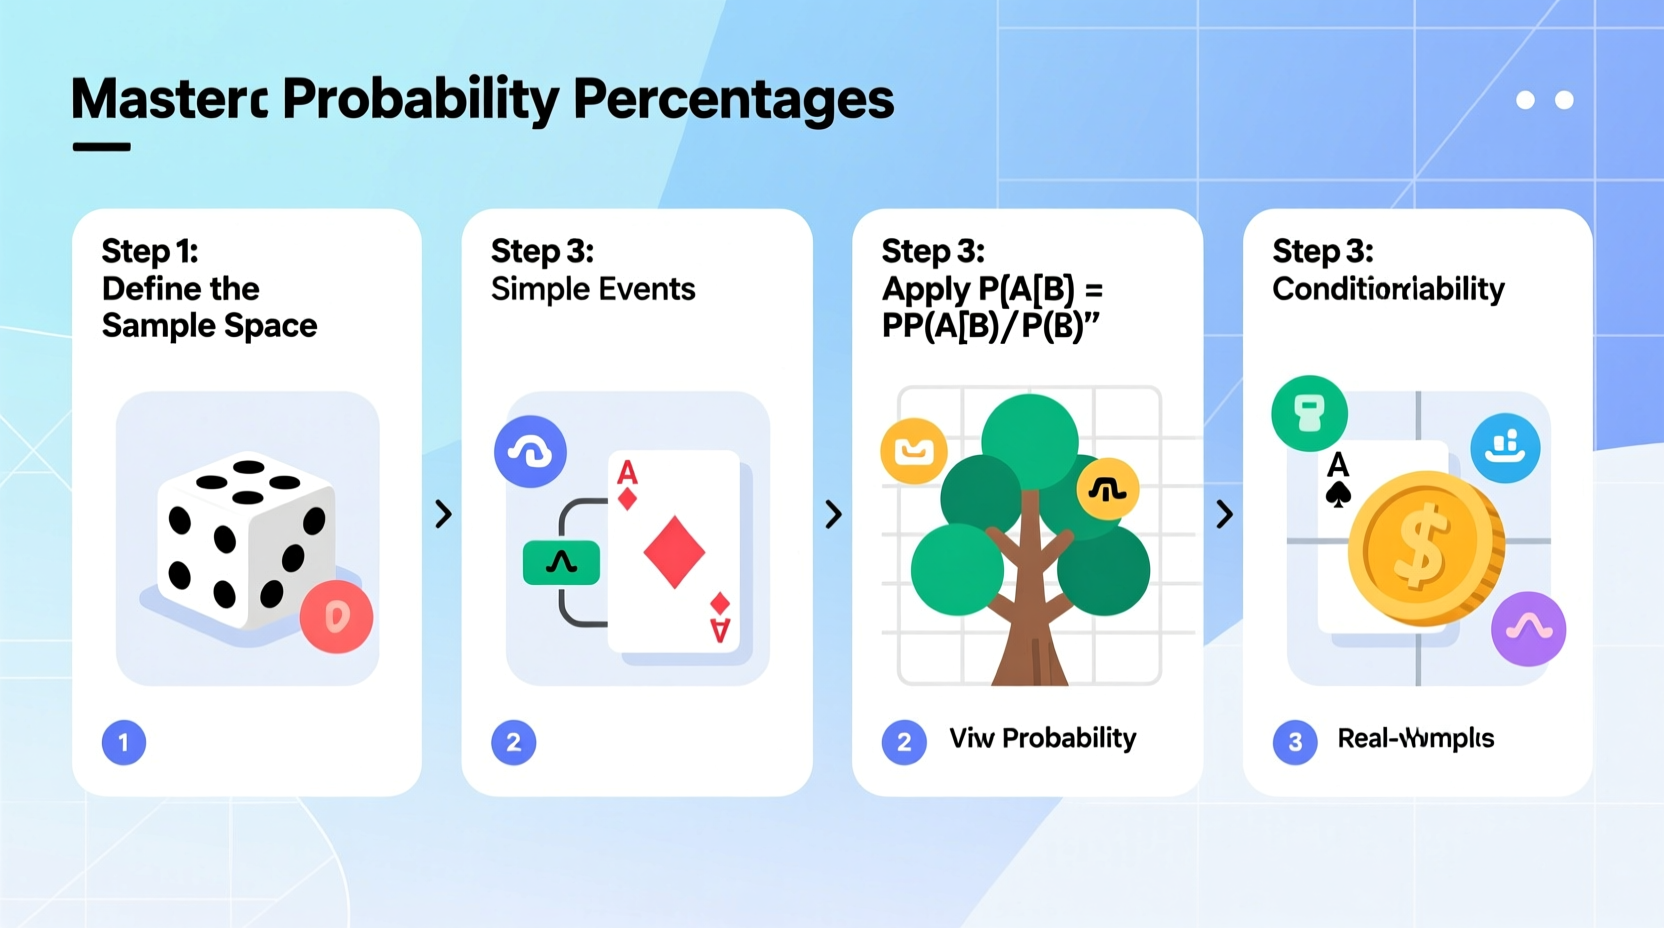
To calculate probability percentages reliably, follow this structured approach:
- Define the Event: Clearly identify what outcome you're measuring (e.g., rolling a 6 on a die).
- List All Possible Outcomes: Determine the full sample space (e.g., numbers 1 through 6 on a standard die).
- Count Favorable Outcomes: How many ways can your desired event happen?
- Apply the Formula: Divide favorable outcomes by total outcomes.
- Convert to Percentage: Multiply the result by 100 for readability.
Using our die example:
- Event: Rolling a 6
- Total outcomes: 6 (faces of the die)
- Favorable outcomes: 1
- Probability: 1/6 ≈ 0.1667
- Percentage: 0.1667 × 100 ≈ 16.67%
This method works consistently whether dealing with dice, cards, weather forecasts, or business projections.
Handling Compound Events: And vs. Or
Real-life situations often involve multiple events. Knowing how to combine probabilities correctly is essential.
Independent Events (AND Rule): When two events don’t affect each other, multiply their individual probabilities.
Example: What's the chance of flipping heads twice in a row?
P(Heads) = 0.5 → P(Heads AND Heads) = 0.5 × 0.5 = 0.25 → 25%
Mutually Exclusive Events (OR Rule): If only one of several outcomes can happen, add their probabilities.
Example: What's the chance of rolling a 1 or a 2 on a six-sided die?
P(1 or 2) = (1/6) + (1/6) = 2/6 = 1/3 ≈ 33.3%
Be cautious: if events aren't mutually exclusive (they can both happen), subtract the overlap to avoid double-counting.
Common Pitfalls and How to Avoid Them
Even experienced analysts make mistakes when estimating probabilities. Recognizing these errors improves accuracy.
| Mistake | Why It Happens | How to Fix It |
|---|---|---|
| Assuming independence incorrectly | Believing events don’t influence each other when they do | Analyze context—e.g., drawing cards without replacement affects future odds |
| Ignoring sample size | Trusting small data sets as representative | Use larger samples; apply statistical significance testing |
| Overlooking conditional probability | Failing to account for prior knowledge | Use Bayes’ Theorem when new information changes likelihoods |
| Confusing correlation with causation | Assuming one event causes another because they occur together | Seek controlled studies or causal models before concluding |
Real-World Application: A Mini Case Study
Sarah manages inventory for a retail chain and needs to forecast demand for winter jackets. Historical data shows that in 45 out of the past 100 winters, temperatures dropped below freezing during peak sales season. Based on this:
P(Cold Winter) = 45/100 = 45%
She also knows that when it’s cold, 70% of stores sell out of jackets within four weeks. But if it’s warm, only 25% reach that level of sales.
To estimate overall stock requirements, she uses conditional probability:
P(Sell-Out) = P(Cold) × P(Sell-Out | Cold) + P(Warm) × P(Sell-Out | Warm)
= (0.45 × 0.70) + (0.55 × 0.25) = 0.315 + 0.1375 = 0.4525 → 45.25%
This tells her roughly 45% of store locations will likely sell out, guiding her to allocate extra inventory strategically rather than overstocking universally.
“Accurate probability assessment separates reactive guesswork from proactive planning.” — Dr. Alan Reyes, Decision Science Professor, MIT
Essential Checklist for Reliable Probability Work
Before finalizing any calculation, review this checklist:
- ☑ Defined the event clearly and specifically
- ☑ Listed all possible outcomes without gaps or overlaps
- ☑ Verified whether events are independent, dependent, or mutually exclusive
- ☑ Applied the correct rule (multiplication for AND, addition for OR)
- ☑ Converted fractions to decimals accurately
- ☑ Multiplied by 100 to express as a percentage
- ☑ Double-checked assumptions against real-world constraints
Frequently Asked Questions
Can a probability ever be more than 100%?
No. A probability above 100% violates the fundamental definition of likelihood. If your calculation exceeds 100%, recheck for duplicated outcomes or incorrect addition of non-exclusive events.
How do I handle probabilities when outcomes aren’t equally likely?
You must weight each outcome by its actual frequency or likelihood. For instance, a weighted die might land on 6 twice as often as other numbers. In such cases, use empirical data or known distributions instead of assuming equal chances.
Is probability just about guessing?
No. While uncertainty is inherent, probability provides a rigorous framework for quantifying that uncertainty. With proper data and logic, it transforms vague intuition into measurable insight.
Conclusion: Turn Uncertainty Into Confidence
Mastering probability percentages isn’t reserved for mathematicians or statisticians. It’s a skill accessible to anyone willing to apply structured thinking to uncertain situations. By defining events clearly, using the right formulas, avoiding common traps, and grounding calculations in reality, you gain a powerful advantage in personal and professional decisions.
Whether you're evaluating investment risks, planning project timelines, or simply playing board games with friends, accurate probability assessment sharpens your judgment. Start small—practice with everyday scenarios—and build confidence through repetition.


 浙公网安备
33010002000092号
浙公网安备
33010002000092号 浙B2-20120091-4
Comments
No comments yet. Why don't you start the discussion?