
Variance is a fundamental concept in statistics that measures how spread out a set of data points are from the mean. When working with a sample—rather than an entire population—it's crucial to use the correct formula to avoid bias in your results. Understanding how to calculate sample variance empowers researchers, students, and analysts to interpret data accurately. This guide walks through the process in detail, using real-world examples and practical tips to ensure clarity and confidence in your calculations.
Why Sample Variance Matters
When you collect data, it’s often impractical or impossible to gather information from every member of a population. Instead, statisticians rely on samples. However, sample data tends to underestimate the true variability of the population because extreme values may not be included. To correct this, sample variance uses Bessel’s correction—dividing by \\(n - 1\\) instead of \\(n\\)—to provide an unbiased estimate of population variance.
“Using \\(n - 1\\) in the denominator reduces systematic error in variance estimation, making it more accurate for inference.” — Dr. Alan Torres, Biostatistician
This adjustment ensures that conclusions drawn from sample data are more reliable when generalized to larger populations.
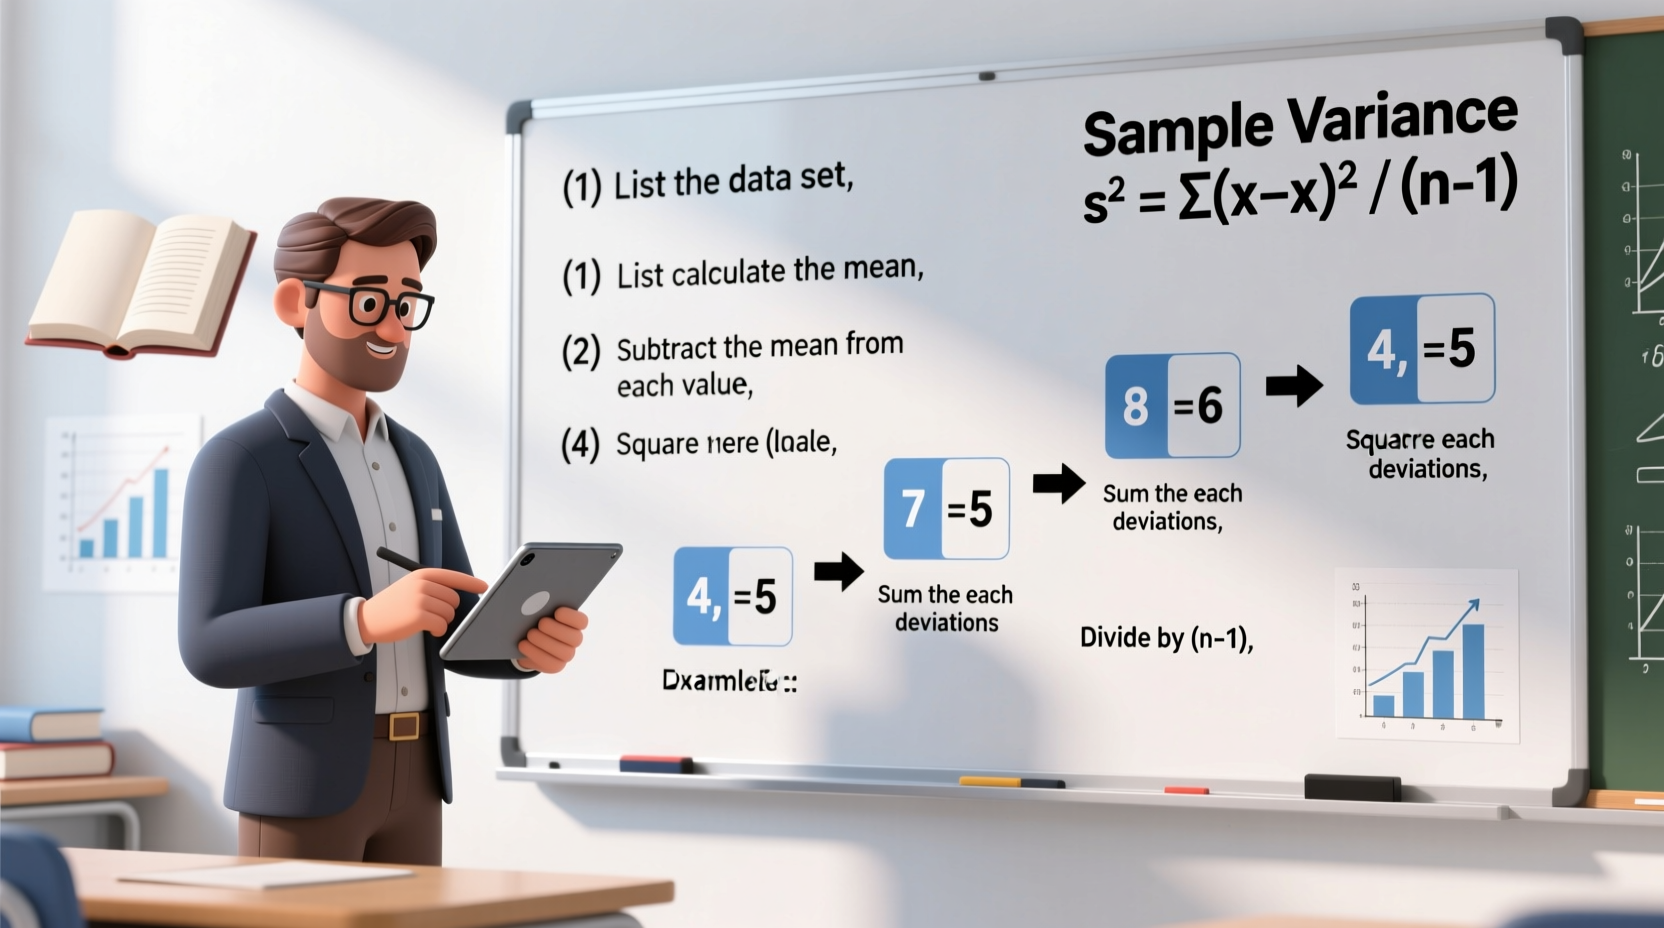
Step-by-Step Guide to Calculate Sample Variance
Follow these six steps to compute the sample variance manually. We’ll walk through each stage using a practical example.
Step 1: Collect Your Sample Data
Gather the numerical values you want to analyze. For instance, suppose a teacher records the test scores of five randomly selected students:
- 85
- 90
- 78
- 92
- 88
Step 2: Find the Sample Mean (\\(\\bar{x}\\))
Add all the data points and divide by the number of observations (\\(n\\)).
\\[ \\bar{x} = \\frac{85 + 90 + 78 + 92 + 88}{5} = \\frac{433}{5} = 86.6 \\]
Step 3: Subtract the Mean from Each Data Point
Calculate the deviation of each value from the mean.
- \\(85 - 86.6 = -1.6\\)
- \\(90 - 86.6 = 3.4\\)
- \\(78 - 86.6 = -8.6\\)
- \\(92 - 86.6 = 5.4\\)
- \\(88 - 86.6 = 1.4\\)
Step 4: Square Each Deviation
Squaring removes negative signs and emphasizes larger deviations.
- \\((-1.6)^2 = 2.56\\)
- \\((3.4)^2 = 11.56\\)
- \\((-8.6)^2 = 73.96\\)
- \\((5.4)^2 = 29.16\\)
- \\((1.4)^2 = 1.96\\)
Step 5: Sum the Squared Deviations
Add up all the squared differences:
\\[ 2.56 + 11.56 + 73.96 + 29.16 + 1.96 = 119.2 \\]
Step 6: Divide by \\(n - 1\\)
With \\(n = 5\\), divide the sum by \\(5 - 1 = 4\\):
\\[ s^2 = \\frac{119.2}{4} = 29.8 \\]
The sample variance is 29.8.
Practical Example: Comparing Two Classes
Let’s apply this method to compare student performance across two classes. The goal is to determine which class has more variable test scores.
| Class A Scores | Class B Scores |
|---|---|
| 70, 75, 80, 85, 90 | 60, 70, 80, 90, 100 |
Both have a mean of 80, but their spreads differ.
Class A:
Deviations: \\(-10, -5, 0, 5, 10\\)
Squared: \\(100, 25, 0, 25, 100\\)
Sum: \\(250\\)
Variance: \\(250 / 4 = 62.5\\)
Class B:
Deviations: \\(-20, -10, 0, 10, 20\\)
Squared: \\(400, 100, 0, 100, 400\\)
Sum: \\(1000\\)
Variance: \\(1000 / 4 = 250\\)
Even though both classes average 80, Class B shows much greater variability in performance. This insight could inform teaching strategies—perhaps Class B needs more differentiated instruction.
Checklist: How to Accurately Compute Sample Variance
Use this checklist to ensure accuracy in every calculation:
- ✅ Confirm you’re working with a sample, not a population
- ✅ Count the number of data points (\\(n\\))
- ✅ Calculate the mean correctly
- ✅ Subtract the mean from each value (include negative signs)
- ✅ Square each deviation
- ✅ Sum the squared deviations
- ✅ Divide by \\(n - 1\\), not \\(n\\)
- ✅ Label the result as \\(s^2\\) (sample variance)
- ✅ Consider taking the square root for standard deviation if needed
Common Mistakes to Avoid
Missteps in calculating variance can lead to incorrect conclusions. Be aware of these frequent errors:
| Mistake | Correct Approach |
|---|---|
| Using \\(n\\) instead of \\(n - 1\\) | Always divide by \\(n - 1\\) for sample variance |
| Forgetting to square deviations | Squaring prevents cancellation of positive/negative values |
| Rounding too early | Keep decimals until the final step to maintain precision |
| Confusing sample and population variance | Sample: \\(s^2 = \\frac{\\sum(x_i - \\bar{x})^2}{n-1}\\) Population: \\(\\sigma^2 = \\frac{\\sum(x_i - \\mu)^2}{N}\\) |
=VAR.S() computes sample variance automatically.
Frequently Asked Questions
What is the difference between sample variance and population variance?
Sample variance estimates variability from a subset of data and divides by \\(n - 1\\) to reduce bias. Population variance uses all data points and divides by \\(N\\), the total population size. Using the wrong formula can distort statistical conclusions.
Can variance be negative?
No. Because deviations are squared before averaging, variance is always zero or positive. A variance of zero means all values are identical.
How is variance related to standard deviation?
Standard deviation is the square root of variance. While variance is in squared units (e.g., points²), standard deviation returns to the original unit (e.g., test points), making it easier to interpret.
Conclusion and Next Steps
Calculating sample variance is a critical skill for anyone working with data. It reveals how much variation exists within a dataset and supports deeper statistical analysis, such as hypothesis testing or confidence intervals. By following the structured steps outlined here—and avoiding common pitfalls—you can confidently compute and interpret variance in academic, professional, or personal projects.
Now that you understand the mechanics, try applying this method to your own datasets. Whether analyzing survey responses, financial returns, or sports statistics, mastering sample variance gives you a stronger foundation for data-driven decisions.


 浙公网安备
33010002000092号
浙公网安备
33010002000092号 浙B2-20120091-4
Comments
No comments yet. Why don't you start the discussion?