
Percentiles are essential tools in statistics that help interpret data distribution and relative standing. Whether you're analyzing test scores, income levels, or performance metrics, understanding where a value stands in relation to others is crucial. Unlike averages, which can be misleading, percentiles offer a clearer picture of position within a dataset. Despite their usefulness, many struggle with accurate calculation due to inconsistent formulas or misinterpretation of ranks. This guide breaks down the process into clear, actionable steps—ensuring precision regardless of dataset size or complexity.
Understanding Percentiles: What They Really Mean
A percentile indicates the value below which a given percentage of observations in a group fall. For example, if a student scores in the 85th percentile on an exam, it means they scored higher than 85% of the participants. It does not mean they answered 85% of the questions correctly. This distinction is critical.
Percentiles are especially useful when comparing individuals across different groups or evaluating performance trends. Common applications include standardized testing (e.g., SAT, GRE), healthcare (growth charts for children), and finance (income distribution analysis).
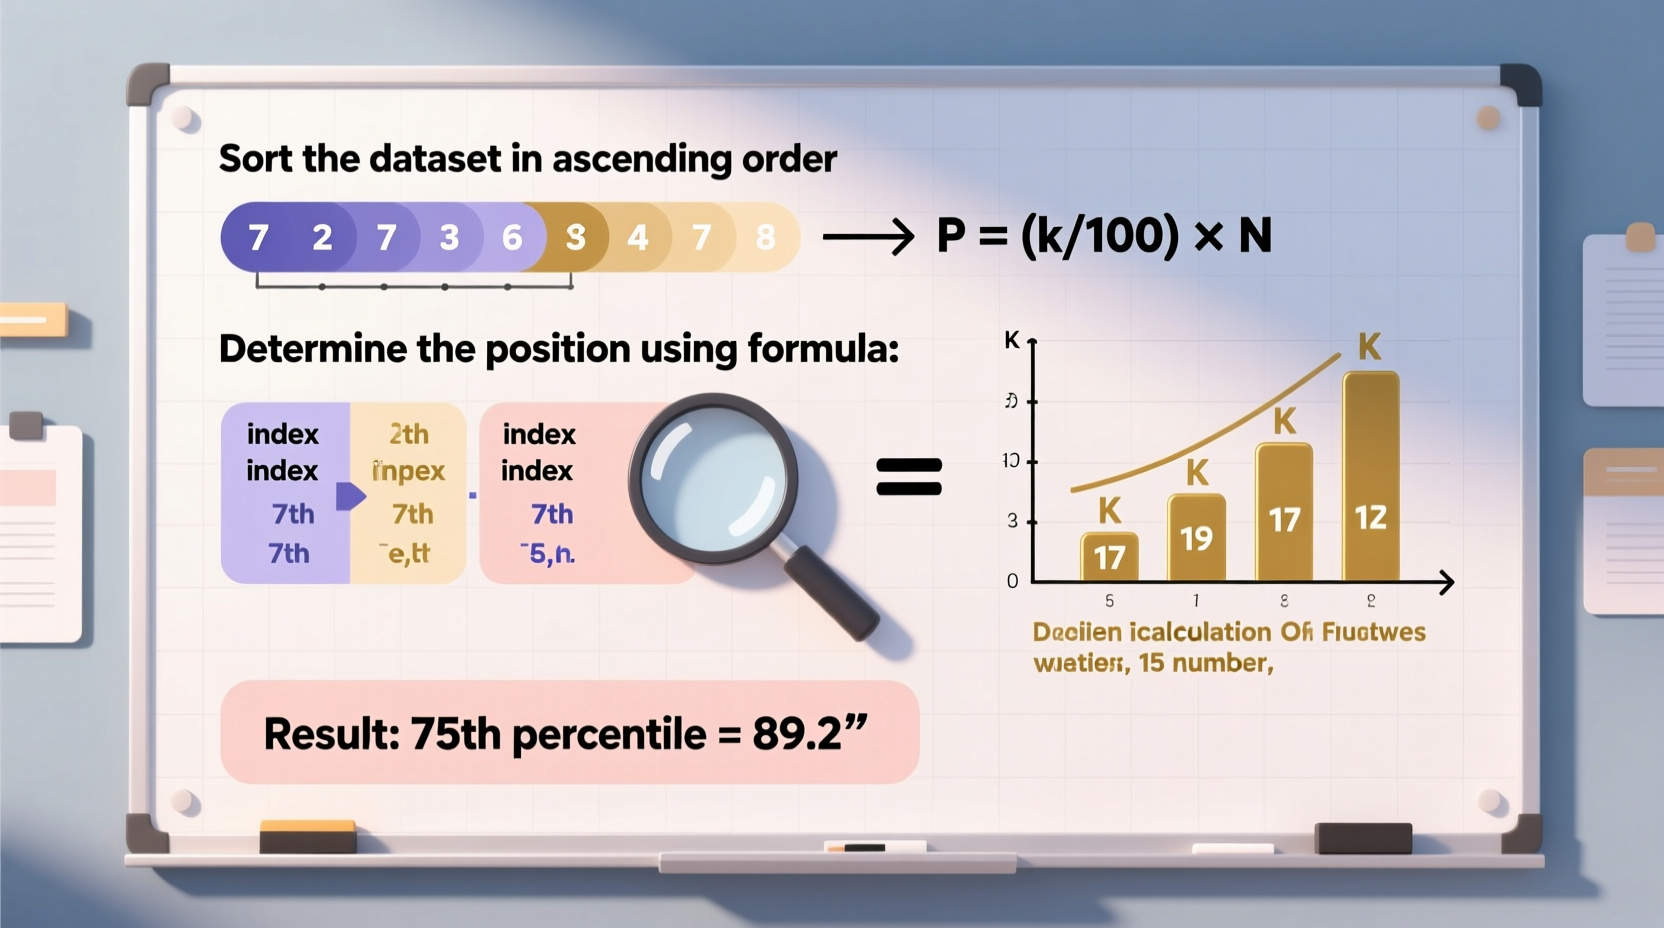
The most widely used percentile method follows the formula:
Pk = Value at the k-th percentile = (k / 100) × (n + 1)
Where k is the desired percentile (e.g., 90 for the 90th percentile) and n is the number of data points.
“Percentiles provide context that raw scores often lack. They transform numbers into meaningful comparisons.” — Dr. Alan Reyes, Biostatistician at Johns Hopkins University
Step-by-Step Guide to Calculating Percentiles
Follow this systematic approach to compute any percentile accurately, whether manually or using software.
- Sort the Data in Ascending Order
Begin by arranging all values from smallest to largest. This step is non-negotiable—percentile calculations depend on ordered data. - Determine the Desired Percentile Rank
Decide which percentile you want to find (e.g., 25th, 50th, 99th). Let’s denote this as k. - Calculate the Index Position
Use the formula: i = (k / 100) × n, where n is the total number of observations.
- If i is not an integer, round up to the next whole number. The value at that position is your percentile.
- If i is an integer, take the average of the values at positions i and i+1. - Locate the Value in the Ordered Dataset
Refer back to your sorted list and identify the value(s) corresponding to the calculated index. - Verify Using Interpolation (Optional for Precision)
For greater accuracy—especially in large datasets—apply linear interpolation between adjacent values when the index falls between two integers.
Practical Example: Calculating the 75th Percentile
Consider the following dataset of exam scores (out of 100):
[68, 72, 74, 76, 78, 80, 82, 85, 88, 90]
We’ll calculate the 75th percentile step by step.
- Sorted Data: Already arranged in ascending order.
- Desired Percentile (k): 75
- Number of Observations (n): 10
- Index Calculation: i = (75 / 100) × 10 = 7.5
- Interpretation: Since 7.5 is not an integer, we round up to 8.
- Result: The 8th value in the list is 85. Therefore, the 75th percentile is 85.
This means 75% of students scored 85 or lower.
Alternative Method: Using (n + 1) Formula
Some statisticians prefer the formula: i = (k / 100) × (n + 1)
Using the same dataset:
i = (75 / 100) × (10 + 1) = 0.75 × 11 = 8.25
Since 8.25 lies between the 8th and 9th values (85 and 88), apply linear interpolation:
Percentile = 85 + 0.25 × (88 – 85) = 85 + 0.75 = 85.75
This refined result suggests that the true 75th percentile lies slightly above 85.
“In real-world analytics, interpolation reduces error margins and improves decision-making accuracy.” — Prof. Linda Tran, Data Science Department, MIT
Common Methods Across Software Tools
Different platforms use varying algorithms to compute percentiles. Understanding these differences prevents confusion when results don’t match manual calculations.
| Tool | Method Used | Notes |
|---|---|---|
| Excel (PERCENTILE.INC) | Inclusive method based on (n - 1) | Includes both endpoints; default for backward compatibility |
| Excel (PERCENTILE.EXC) | Exclusive method based on (n + 1) | Excludes extreme percentiles like 0th and 100th |
| Python (NumPy .percentile()) | Linear interpolation by default | Highly customizable with interpolation options |
| R (quantile()) | Type 7 (default): similar to Excel INC | Offers nine different methods via 'type=' parameter |
| Google Sheets | Same as Excel PERCENTILE.INC | Widely accessible but less flexible |
Checklist: Ensuring Accurate Percentile Calculation
- ✅ Sort the dataset in ascending order before starting
- ✅ Confirm the sample size (n)
- ✅ Choose the correct formula based on your needs (inclusive vs exclusive)
- ✅ Apply interpolation when the index is not a whole number
- ✅ Cross-validate results using software if possible
- ✅ Document your method for reproducibility
Real-World Scenario: Salary Distribution Analysis
A human resources analyst at a mid-sized tech company wants to benchmark salaries against industry standards. The dataset includes annual salaries (in thousands) for 15 employees:
[54, 58, 60, 62, 64, 66, 68, 70, 72, 74, 76, 78, 80, 82, 85]
The goal is to find the 90th percentile to assess competitive compensation.
Using the index formula: i = (90 / 100) × 15 = 13.5 → Round up to 14
The 14th value is 82. So, the 90th percentile salary is $82,000.
This tells HR that 90% of employees earn $82,000 or less. If market data shows top performers earning $90,000+, the company may need to adjust its pay scale to remain competitive.
Frequently Asked Questions
Can a percentile be equal to the maximum value?
Yes, but only under specific conditions. The 100th percentile technically represents the highest value, though some statistical methods exclude it because no observation exceeds it. In practice, values like the 99th percentile are more commonly used to represent near-maximum thresholds.
Is the median the same as the 50th percentile?
Yes. The median divides the dataset into two equal halves, making it equivalent to the 50th percentile. Both indicate the middle value when data is ordered.
Why do my Excel and Python results differ?
Different default algorithms. Excel uses linear interpolation over (n–1), while Python’s NumPy uses a slightly different base. To align results, specify the interpolation method explicitly in code—for example, using interpolation='linear' or matching the mathematical approach.
Final Thoughts and Action Steps
Calculating percentiles accurately empowers better decisions—from setting benchmarks to identifying outliers. While the math may seem subtle, consistency in method and attention to detail yield reliable insights. Whether you're a student, researcher, or analyst, mastering this skill enhances your ability to interpret real-world data meaningfully.
Start applying these techniques today: clean your data, choose your method wisely, and validate results across tools. Share your findings transparently, noting the approach used. Accuracy builds trust—and in data-driven fields, trust is everything.


 浙公网安备
33010002000092号
浙公网安备
33010002000092号 浙B2-20120091-4
Comments
No comments yet. Why don't you start the discussion?