
In statistics, making sense of real-world data often begins with drawing conclusions from samples rather than entire populations. One of the most fundamental tools in this process is p hat, symbolized as \\(\\hat{p}\\), which represents the sample proportion. Whether you're analyzing survey results, testing product defect rates, or evaluating public opinion, mastering the concept of \\(\\hat{p}\\) empowers you to make informed decisions based on limited data.
This guide breaks down what p hat is, how it’s calculated, and why it matters in statistical inference. More importantly, it shows you how to apply it correctly in practical scenarios while avoiding common pitfalls.
What Is P Hat and Why It Matters
The term \"p hat\" (\\(\\hat{p}\\)) refers to the proportion of individuals in a sample that exhibit a particular characteristic. For example, if 38 out of 100 voters in a poll support a specific policy, then \\(\\hat{p} = 0.38\\). This value serves as an estimate of the true population proportion \\(p\\), which is usually unknown.
Because collecting data from every individual in a population is often impractical or impossible, statisticians rely on random sampling. The sample proportion becomes the best point estimate of the population parameter. However, unlike the population proportion (a fixed but unknown value), \\(\\hat{p}\\) varies from sample to sample due to sampling variability.
“P hat is more than just a fraction—it's a bridge between observed data and broader truth.” — Dr. Linda Tran, Biostatistics Professor at Northwestern University
Understanding this distinction is crucial. A single \\(\\hat{p}\\) doesn’t tell the whole story; its reliability depends on sample size, randomness, and context.
How to Calculate and Interpret P Hat
Calculating \\(\\hat{p}\\) is straightforward:
- Count the number of individuals in your sample with the trait of interest (\\(x\\)).
- Divide by the total sample size (\\(n\\)).
The formula is:
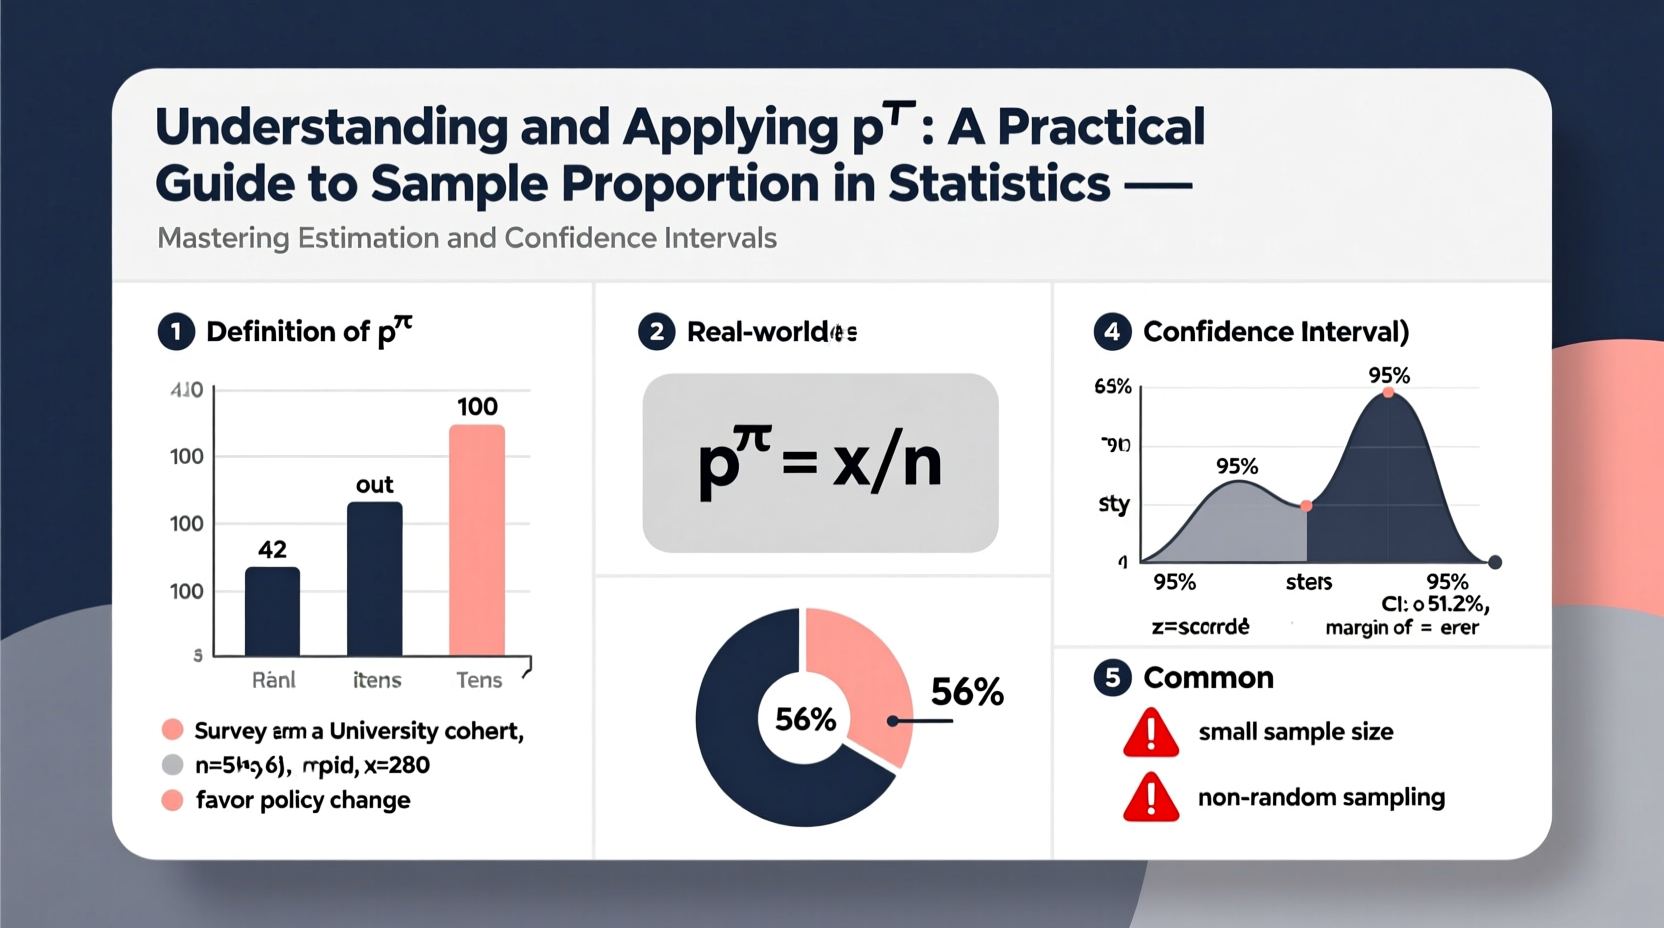
\\[\\hat{p} = \\frac{x}{n}\\]
For instance, suppose a quality control team inspects 250 smartphones and finds 18 with manufacturing defects. Then:
\\[\\hat{p} = \\frac{18}{250} = 0.072\\]
This means 7.2% of the sampled phones were defective—an estimate of the overall defect rate in production.
Interpreting \\(\\hat{p}\\) requires caution. It reflects only the sample, not the entire population. If another sample were taken, the result might differ slightly. This variation is natural and expected, but it underscores the need for proper statistical methods when drawing conclusions.
Conditions for Reliable Inference Using P Hat
While \\(\\hat{p}\\) provides a useful estimate, its validity hinges on meeting certain conditions before performing inference such as confidence intervals or hypothesis tests. These criteria ensure that the sampling distribution of \\(\\hat{p}\\) is approximately normal.
| Condition | Description | Check Example |
|---|---|---|
| Random Sample | Data must come from a randomly selected sample. | Survey conducted via random digit dialing. |
| Independence | Sample size ≤ 10% of population (if sampling without replacement). | Sampling 150 people from a city of 15,000+. |
| Large Enough Sample | At least 10 successes and 10 failures expected. | If \\(\\hat{p}=0.4\\), then \\(n \\geq 25\\) since \\(0.4n \\geq 10\\) and \\(0.6n \\geq 10\\). |
When these conditions are met, the sampling distribution of \\(\\hat{p}\\) follows a normal model with mean \\(p\\) and standard error:
\\[SE = \\sqrt{\\frac{\\hat{p}(1 - \\hat{p})}{n}}\\]
This allows us to construct confidence intervals using the formula:
\\[\\hat{p} \\pm z^* \\cdot SE\\]
where \\(z^*\\) is the critical value corresponding to the desired confidence level (e.g., 1.96 for 95%).
Step-by-Step Guide to Applying P Hat in Real Analysis
Let’s walk through a complete example of using \\(\\hat{p}\\) to estimate a population proportion.
- Define the objective: Estimate the proportion of college students who prefer online classes.
- Collect a random sample: Survey 400 students; 228 say they prefer online learning.
- Calculate \\(\\hat{p}\\): \\(\\hat{p} = 228 / 400 = 0.57\\)
- Check conditions:
- Random? Yes, stratified random sampling used.
- Independence? Sample is less than 10% of all college students nationwide.
- Success-failure? \\(400 \\times 0.57 = 228\\) and \\(400 \\times 0.43 = 172\\), both >10.
- Compute standard error: \\[SE = \\sqrt{\\frac{0.57(1 - 0.57)}{400}} = \\sqrt{\\frac{0.2451}{400}} \\approx 0.0248\\]
- Construct 95% confidence interval: \\[0.57 \\pm 1.96 \\times 0.0248 = 0.57 \\pm 0.0486\\]
- Interpret: We are 95% confident that the true proportion of college students preferring online classes is between 52.1% and 61.9%.
Mini Case Study: Estimating Voter Support Before an Election
A political campaign manager wants to gauge support for a mayoral candidate in a city of 200,000 eligible voters. They commission a poll of 600 randomly selected residents. Of those surveyed, 330 indicate they plan to vote for the candidate.
Here, \\(\\hat{p} = 330 / 600 = 0.55\\), suggesting majority support. But is this enough to claim a lead?
First, check assumptions:
- Random sample? Verified through third-party polling firm.
- Independence? 600 is far below 10% of 200,000.
- Success-failure? \\(600 \\times 0.55 = 330\\), \\(600 \\times 0.45 = 270\\) — both exceed 10.
Standard error: \\[SE = \\sqrt{\\frac{0.55 \\times 0.45}{600}} \\approx 0.0203\\]
Margin of error (95% CI): \\(1.96 \\times 0.0203 \\approx 0.0398\\)
Confidence interval: \\(0.55 \\pm 0.0398\\) → (0.510, 0.590)
The interval ranges from 51.0% to 59.0%, entirely above 50%. This provides statistically significant evidence that a majority of voters likely support the candidate—valuable insight for strategic planning.
Frequently Asked Questions
Can p hat ever equal the true population proportion p?
Possibly, but unlikely. Since \\(\\hat{p}\\) is based on a sample, it usually differs slightly from \\(p\\). However, with large, well-drawn samples, \\(\\hat{p}\\) tends to be very close.
What happens if the sample size is too small?
Small samples increase variability and risk violating the success-failure condition. Results become unreliable, and the normal approximation fails. Aim for at least 10 expected successes and failures.
Is p hat biased?
No. \\(\\hat{p}\\) is an unbiased estimator of \\(p\\), meaning its long-run average across many samples equals the true population proportion.
Key Takeaways and Action Checklist
Mastering p hat isn’t just about formulas—it’s about thinking critically about data. Use this checklist to ensure sound application:
- ☑ Clearly define the population and the binary outcome of interest.
- ☑ Ensure your sample is random and representative.
- ☑ Calculate \\(\\hat{p} = x/n\\) accurately.
- ☑ Verify the three inference conditions (randomness, independence, sample size).
- ☑ Compute and interpret confidence intervals appropriately.
- ☑ Report both \\(\\hat{p}\\) and the margin of error for transparency.
- ☑ Avoid overgeneralizing beyond the sample scope.
Conclusion: Turn Data Into Insight
Understanding and applying p hat is foundational in statistics. It transforms raw counts into meaningful proportions, enabling estimation, comparison, and decision-making under uncertainty. From healthcare research to market analysis, the ability to interpret \\(\\hat{p}\\) correctly separates anecdotal claims from evidence-based conclusions.
Start applying these principles in your next project. Whether you’re analyzing customer feedback, conducting academic research, or interpreting news polls, treat every proportion as more than a number—see it as an estimate shaped by methodology and chance. With careful practice, you’ll turn sample data into reliable insights.


 浙公网安备
33010002000092号
浙公网安备
33010002000092号 浙B2-20120091-4
Comments
No comments yet. Why don't you start the discussion?