
The S&P 500 is one of the most widely followed stock market indices in the world. When investors talk about “the market,” they often mean the S&P 500. But if you’ve spent time researching funds, ETFs, or market data, you may have noticed something puzzling: there isn’t just one S&P 500. There are dozens—S&P 500 Total Return, S&P 500 Gross, S&P 500 Net, S&P 500 Equal Weight, S&P 500 ESG, and more. Why do so many versions exist? And what do these differences mean for investors?
The answer lies in how financial indices are constructed, maintained, and adapted to meet specific investor needs. Each variation serves a unique purpose—whether it’s accounting for dividends, adjusting for taxes, emphasizing sustainability, or altering weighting methodologies. Understanding these distinctions is crucial for making informed investment decisions and interpreting performance accurately.
What Is the Standard S&P 500 Index?
The original S&P 500, launched in 1957 by Standard & Poor’s, tracks the performance of 500 large-cap U.S. companies selected by a committee based on market size, liquidity, and sector representation. It is market-capitalization weighted, meaning that larger companies like Apple or Microsoft have a greater influence on the index’s movement than smaller constituents.
This base version—often referred to as the S&P 500 Price Index—measures only price changes. It does not include reinvested dividends. While useful for tracking headline movements, it doesn’t reflect the full return an investor would earn by holding all 500 stocks.
“Many investors don’t realize they’re looking at a partial picture when they check the standard S&P 500 price chart.” — Dr. Lisa Tran, Financial Markets Analyst, Morningstar Research
Why So Many Variations Exist
The proliferation of S&P 500 variants stems from evolving investor demands and analytical requirements. Market professionals need tools that reflect different assumptions, strategies, and economic conditions. Here are the main reasons for the diversity:
- Performance measurement precision: Some investors want to see returns with dividends reinvested; others need pre-tax vs. post-tax views.
- Strategy replication: Fund managers create products (like ETFs) that track modified versions of the index to offer different risk-return profiles.
- Thematic investing: Variants like the S&P 500 ESG Index cater to investors focused on environmental, social, and governance criteria.
- Academic and institutional research: Researchers use adjusted versions to isolate variables such as volatility, turnover, or tax impacts.
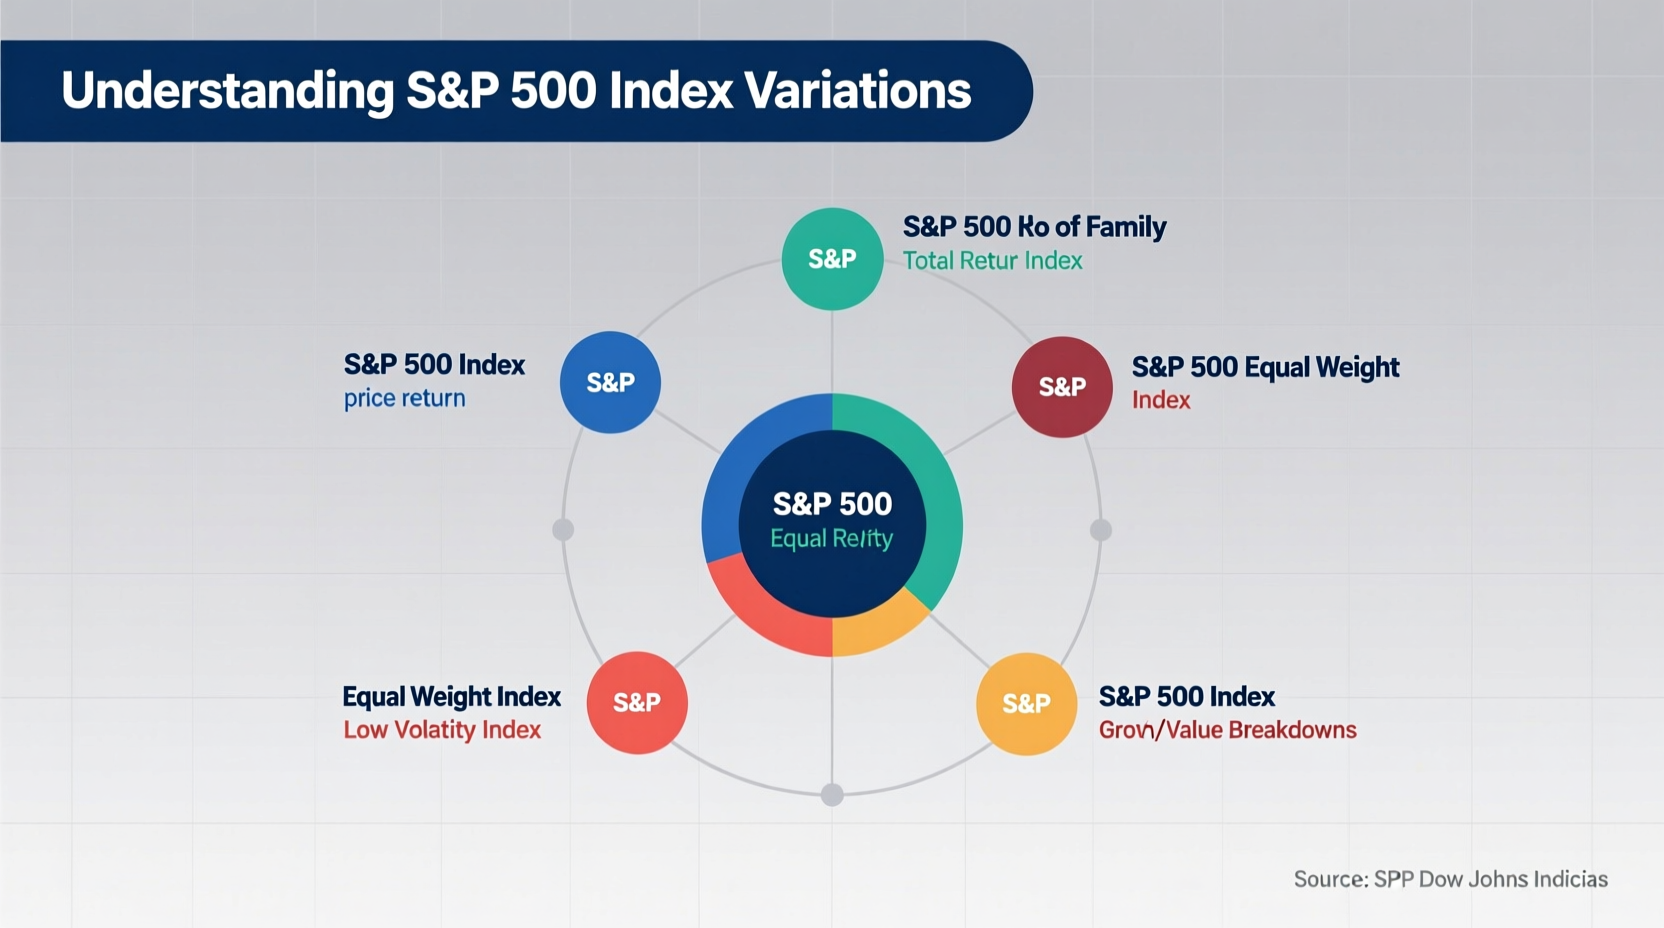
Common S&P 500 Variants and What They Mean
Below is a comparison of key S&P 500 variations, their methodology, and intended use cases:
| Variation | Key Feature | Use Case | Example Provider |
|---|---|---|---|
| S&P 500 Price Index | Price changes only, no dividends | Short-term market tracking | S&P Dow Jones Indices |
| S&P 500 Total Return | Includes reinvested dividends | Long-term investment performance | S&P Dow Jones Indices |
| S&P 500 Net Total Return | Dividends reinvested after withholding tax | International investor analysis | S&P Dow Jones Indices |
| S&P 500 Equal Weight | All companies weighted equally (~0.2%) | Diversification, small-cap exposure | Invesco (ticker: RSP) |
| S&P 500 ESG Index | Excludes low ESG scorers, caps high-impact sectors | Sustainable investing | S&P Dow Jones Indices |
| S&P 500 Pure Growth / Value | Separates stocks based on fundamental growth/value metrics | Factor-based investing | S&P Dow Jones Indices |
Total Return vs. Price Return: A Real Difference
Consider this: between 1990 and 2023, the S&P 500 Price Index returned about 9.5% annually. The S&P 500 Total Return Index, which assumes dividends are reinvested, returned approximately 11.8%. That 2.3% difference compounds dramatically over time. An initial $10,000 investment would grow to $105,000 under price return—but over $230,000 under total return.
Mini Case Study: Choosing the Right Index for Your ETF
Jamal, a financial advisor, was helping a client compare two S&P 500 ETFs: one tracking the standard index and another linked to the equal-weight version. At first glance, both seemed similar. But Jamal dug deeper.
He found that the traditional ETF was heavily concentrated in tech—about 30% in just five stocks. The equal-weight fund spread exposure evenly, giving smaller companies like Walgreens or Travelers Companies more influence. Over the previous five years, the equal-weight version had slightly higher volatility but outperformed during periods when mid-caps led the market.
Jamal recommended the equal-weight fund for diversification, explaining: “It’s still the S&P 500, but without the mega-cap tilt. It behaves differently.” His client appreciated the clarity and chose the alternative index product.
How Index Variations Impact Investment Decisions
Choosing the right index—or understanding which one your fund follows—can significantly affect outcomes. Here’s how:
- Return expectations: A fund using the Total Return index will naturally show better long-term performance due to dividend reinvestment.
- Risk profile: Equal-weight indices tend to be more volatile because they reduce dominance by stable large caps.
- Tax implications: International investors should pay attention to net vs. gross return indices, as foreign dividend taxes impact real returns.
- Ethical alignment: ESG variants exclude companies involved in tobacco, weapons, or fossil fuels, aligning portfolios with values.
Step-by-Step Guide: How to Identify Which S&P 500 Version You’re Using
- Check your fund’s fact sheet or prospectus. Look for phrases like “tracks the S&P 500” and then verify the exact index name.
- Search the index name directly on S&P Dow Jones Indices’ website. Official documentation will detail methodology.
- Compare historical returns. If your fund’s return is notably higher than the Yahoo Finance S&P 500 chart, it may be tracking a total return version.
- Contact customer service. Ask specifically: “Which S&P 500 variant does this fund track—price, total return, or another?”
- Review holdings and weightings. If Apple is only 0.2% instead of ~7%, it’s likely an equal-weight product.
Checklist: Evaluating S&P 500 Index Products
- ☐ Confirm the exact index name (e.g., \"S&P 500 Total Return\")
- ☐ Determine if dividends are included and how they’re reinvested
- ☐ Check the weighting methodology (market cap vs. equal weight)
- ☐ Review exclusions (e.g., ESG screens)
- ☐ Compare expense ratios across similar index types
- ☐ Assess tracking error history for ETFs
Frequently Asked Questions
Is the S&P 500 I see on CNBC the same as my retirement fund’s benchmark?
Not necessarily. News outlets typically display the S&P 500 Price Index, which shows daily price swings. Your retirement fund may be benchmarked to the Total Return version, which includes dividends. This means your fund could be performing better than the “headline” index suggests.
Why would anyone use an equal-weight S&P 500 instead of the standard one?
The equal-weight version reduces concentration risk. In the traditional index, the top 10 stocks can make up over 30% of the total value. Equal weighting gives every company the same influence, offering broader market exposure and potentially higher returns during rotation periods—though with more volatility.
Does the S&P 500 ESG index perform worse than the regular one?
Not consistently. Over the past five years, the S&P 500 ESG Index has performed comparably to the standard index, sometimes even outperforming it due to lower exposure to declining industries like coal and higher allocations to technology and healthcare. However, performance varies by market cycle.
Conclusion: Clarity Leads to Better Investing
The existence of multiple S&P 500 variations isn’t confusion—it’s choice. Each version serves a distinct analytical or strategic purpose, allowing investors to tailor their approach to goals, risk tolerance, and values. Recognizing the differences between price return, total return, equal weight, and ESG-screened indices empowers smarter decisions.
Don’t settle for surface-level data. Dig into the methodology behind the numbers. Whether you're selecting an ETF, evaluating performance, or planning long-term growth, understanding index variations is a foundational skill in modern investing.


 浙公网安备
33010002000092号
浙公网安备
33010002000092号 浙B2-20120091-4
Comments
No comments yet. Why don't you start the discussion?