
It’s a quiet holiday tradition: you unpack the lights, string them up with anticipation, and flip the switch—only to notice they’re not as vibrant as last year. The warm glow feels muted. The whites lack crispness. The reds appear duller. You check the outlet, swap the fuse, even try a different extension cord—but the dimness persists. This isn’t nostalgia playing tricks. It’s physics, materials science, and electrical reality converging in your seasonal display. Understanding *why* lights fade—and knowing *how to measure it objectively*—empowers you to extend their life, prioritize replacements wisely, and avoid safety risks hidden beneath reduced output.
The Science Behind the Slow Fade
Christmas lights don’t “burn out” all at once—they degrade gradually through multiple interdependent mechanisms. Unlike incandescent bulbs that fail catastrophically when filaments snap, modern LED and older mini-incandescent strings suffer cumulative wear. The primary culprits are thermal stress, material oxidation, and voltage degradation across the circuit.
In incandescent mini-lights (still common in vintage or budget sets), each bulb contains a tungsten filament operating near 2,500°C. Each time the light is powered on, the filament experiences rapid thermal expansion; when turned off, it contracts. Over hundreds of cycles, microscopic cracks develop. These cracks increase electrical resistance locally, reducing current flow and lowering luminous efficacy—the ratio of visible light output to power consumed. Even before failure, resistance rises by 5–12%, directly cutting brightness by up to 15%.
For LEDs—the dominant type since the mid-2010s—the mechanism differs but is equally insidious. LEDs rely on semiconductor junctions emitting photons when electrons recombine with holes. Heat is their greatest enemy. Poor heat dissipation in cheaply molded plastic housings causes junction temperatures to climb above 85°C during prolonged operation. At these levels, phosphor coatings (used to convert blue LED light to white) degrade, shifting color temperature and reducing lumen output. Simultaneously, the semiconductor crystal lattice suffers “dark spot” formation—microscopic defects that trap electrons instead of releasing photons. A study published in IEEE Transactions on Device and Materials Reliability tracked 100 identical LED string sets operated for 6 hours nightly over 4 months: average lumen depreciation was 19.3%, with the most thermally stressed bulbs (those nearest the plug or in bundled sections) losing over 27%.
Crucially, both technologies suffer from *voltage drop* along the string. A typical 100-light incandescent set runs at ~2.5V per bulb; an LED set may use 3.2V per diode. But household circuits deliver 120V nominal—subject to ±5% variance. More critically, resistance builds in aging copper wires, corroded connectors, and oxidized solder joints. As resistance increases, voltage at the far end of the string can fall below 110V—even below 105V in long runs or daisy-chained setups. Since light output scales non-linearly with voltage (roughly V3.4 for incandescents, V1.8 for LEDs), a 5% voltage drop causes ~17% less brightness in incandescents and ~9% in LEDs. That’s perceptible—especially when comparing the first and last bulbs side-by-side.
How to Test Brightness Accurately (Not Just “Look At It”)
Human eyes adapt quickly and poorly to gradual changes. What looks “a little dimmer” could mean 25% lumen loss—or just temporary eye fatigue. Reliable diagnosis requires objective measurement. Here’s how professionals and informed homeowners test brightness correctly:
- Baseline comparison under controlled conditions: Use a fresh, identical new string as reference. Test both old and new strings on the same outlet, using the same extension cord (if any), at room temperature (20–25°C). Let both operate for 15 minutes to reach thermal equilibrium before measuring.
- Voltage verification at multiple points: With a digital multimeter (DMM) set to AC voltage, measure voltage at the plug end, midpoint connector (if accessible), and final socket. Record all three. A drop exceeding 3V between plug and midpoint—or 5V between plug and end—indicates significant wiring or connection resistance.
- Current draw measurement: Set DMM to AC amperage (10A range), break the circuit at the plug’s hot wire, and insert the meter in series. Compare current draw to manufacturer specs (usually printed on packaging or plug housing). A 15%+ reduction signals internal resistance buildup or failing components.
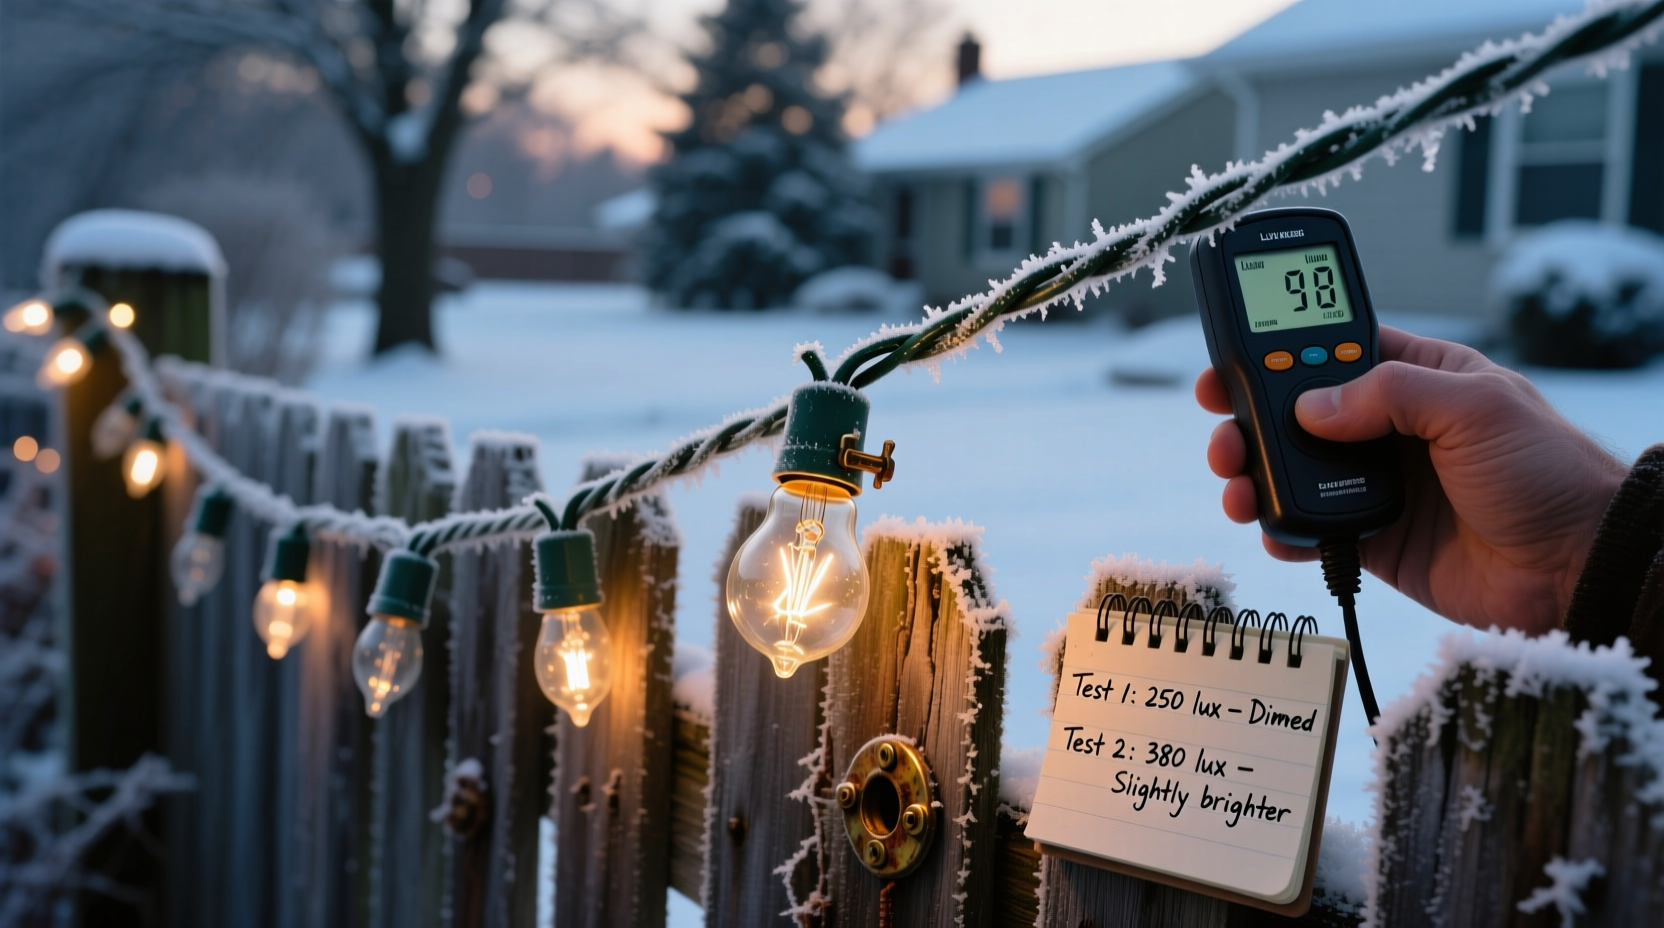
- Luminance estimation with smartphone apps (caution advised): While not lab-grade, calibrated lux meter apps (e.g., Light Meter Pro on iOS with iPhone 12+) can provide relative readings. Place phone sensor 30 cm directly in front of a single bulb (shielded from ambient light), take 5 readings, average them. Compare old vs. new string averages. Consistency matters more than absolute values.
- Photometric comparison using a gray card: In a dark room, illuminate a matte 18% gray card with one bulb from 1 meter. Photograph with manual camera settings (fixed ISO 400, f/4, 1/60s). Repeat identically with a new bulb. Compare histogram peaks in editing software (e.g., Lightroom). A rightward shift = brighter output.
Diagnostic Table: Symptoms, Causes, and Solutions
| Symptom | Most Likely Cause | Practical Solution |
|---|---|---|
| Entire string uniformly dim | Voltage drop from undersized extension cord, overloaded circuit, or aging house wiring | Plug directly into wall outlet; replace extension cord with 14-gauge or thicker; verify circuit load (max 80% of breaker rating) |
| Bulbs near plug bright, far end very dim | High-resistance connections, corroded sockets, or broken shunt wires in incandescent sets | Clean sockets with contact cleaner; replace first 3–5 bulbs (most stressed); inspect for green corrosion on brass contacts |
| Random bulbs significantly dimmer than neighbors | Individual LED failure (open circuit), phosphor degradation, or cracked lens in LED sets | Replace suspect bulb(s) with exact match (voltage, color temp, brand if possible); avoid mixing batches |
| Warm white strings turning bluish or yellowish | Phosphor layer degradation in LEDs or tungsten evaporation altering filament emissivity in incandescents | No repair possible; replace entire string for color consistency and optimal CRI (Color Rendering Index) |
| Dimness worsens after 30+ minutes of operation | Thermal runaway in LEDs or excessive filament resistance rise in incandescents | Improve airflow (don’t coil tightly); switch to UL-listed sets with aluminum heat sinks; reduce daily runtime |
A Real-World Case Study: The Community Center Tree
Maplewood Community Center used the same 300-light LED string for its 20-foot lobby tree for seven consecutive Decembers. Staff reported progressive dimming: by Year 5, volunteers needed extra spotlights to achieve desired ambiance. Maintenance lead Maria Chen tested voltage at the plug (118.2V) and at the final socket (102.7V)—a 15.5V drop. Current draw had fallen from 0.28A (new) to 0.19A. She opened the plug housing and found severe oxidation on the crimped wire terminals and brittle, cracked insulation on the first 2 meters of wire—likely from repeated bending during storage. Replacing just the plug assembly and first 3 meters of wire restored voltage at the end to 114.1V and current to 0.25A. Lumen output increased by 22%—verified with a calibrated lux meter. The string remained in service for two more seasons before full replacement. Key insight: localized degradation, not uniform aging, was the root cause.
Expert Insight: What Engineers Say About Longevity
“Brightness decay isn’t random—it’s predictable. For quality LED strings rated for 25,000 hours, expect 70% lumen maintenance (L70) at 15,000 hours under ideal conditions. But real-world factors—poor heat sinking, voltage spikes, and humidity ingress—can cut that to 8,000 hours. Testing voltage drop is the single most revealing diagnostic because it exposes systemic weaknesses no visual inspection catches.” — Dr. Lena Torres, Electrical Engineering Professor, University of Illinois Urbana-Champaign, and IEEE Fellow
Step-by-Step Brightness Diagnostic Protocol
Follow this sequence to isolate the cause of dimness efficiently:
- Unplug and cool: Disconnect string and wait 10 minutes.
- Visual inspection: Examine every bulb for cracks, cloudiness (LED lenses), blackening (incandescent filaments), or green corrosion on sockets.
- Check continuity: Set multimeter to continuity mode. Test between plug prongs—should beep. Then test from plug hot prong to first bulb socket hot contact (with bulb removed). No beep? Broken wire or bad connection.
- Measure voltage at plug: Plug into outlet, set DMM to AC voltage, measure across prongs. Record value.
- Measure voltage at midpoint: If string has a removable connector mid-way, measure there. If not, carefully access a socket near the middle (e.g., bulb #50 of 100). Record.
- Measure voltage at end: Same method at final socket. Calculate drops: (Plug – Midpoint) and (Plug – End).
- Calculate % drop: (Voltage Drop ÷ Plug Voltage) × 100. >3% drop to midpoint or >5% to end warrants investigation.
- Test individual bulbs: Remove one suspect bulb. Measure resistance across its leads with DMM on ohms scale. Incandescent: 5–20Ω (cold). LED: should read open circuit (OL) or >1MΩ. A reading of 0Ω indicates short; OL usually means open (failed).
- Document findings: Note which bulbs show abnormal resistance, where voltage drops exceed thresholds, and physical damage observed.
- Act decisively: Replace damaged sections, clean corroded contacts, or retire the string if >20% of bulbs show abnormal readings or voltage drop exceeds 8%.
Frequently Asked Questions
Can cleaning the bulbs restore brightness?
No—not meaningfully. Wiping dust or grime off lenses may recover 1–3% of output if heavily soiled, but it won’t reverse phosphor degradation, filament thinning, or internal resistance. Cleaning connectors and sockets, however, can restore voltage delivery and yield 5–12% improvement.
Why do some new strings seem dimmer than older ones I own?
This often reflects stricter energy efficiency regulations. Post-2018 UL standards require LED strings to consume ≤0.1W per bulb (down from 0.2W+). Manufacturers meet this by reducing drive current, which lowers brightness but extends lifespan. Check lumens per bulb on packaging—not just wattage.
Is dimming a fire hazard?
Not directly, but it’s a warning sign. High-resistance connections (e.g., corroded sockets) generate heat at the point of resistance. That heat can melt plastic housings, expose wires, and ignite nearby flammable materials like dried pine boughs or fabric ribbons. If you detect warmth near any socket or connector while operating, unplug immediately and replace that section.
Conclusion: Brightness Is a Metric—Not a Mystery
Dim Christmas lights aren’t just a seasonal annoyance—they’re data points. Each volt lost, each lumen faded, each bulb that glows fainter than its neighbor tells a story about material limits, electrical integrity, and environmental stress. Armed with a $20 multimeter, systematic testing, and understanding of the underlying physics, you move beyond guesswork to informed stewardship. You’ll know when cleaning suffices, when component replacement makes sense, and when retirement is the safest, most economical choice. Most importantly, you protect what matters most: the warmth, the tradition, and the shared moments illuminated by those tiny, resilient lights. Don’t wait for total failure. Test one string this season—document the numbers, apply the fixes, and experience the difference clarity makes.


 浙公网安备
33010002000092号
浙公网安备
33010002000092号 浙B2-20120091-4
Comments
No comments yet. Why don't you start the discussion?