
Earnings per share (EPS) is one of the most closely watched financial metrics in the world of investing. It offers a clear snapshot of a company’s profitability on a per-share basis, making it a vital tool for evaluating stocks. While revenue and market trends provide context, EPS cuts to the core of financial performance—how much profit a company generates for each outstanding share of its stock. Investors use EPS to compare companies, assess growth trends, and make informed buy or sell decisions. Understanding what EPS reveals—and what it doesn’t—is essential for building a sound investment strategy.
What Is Earnings Per Share (EPS)?
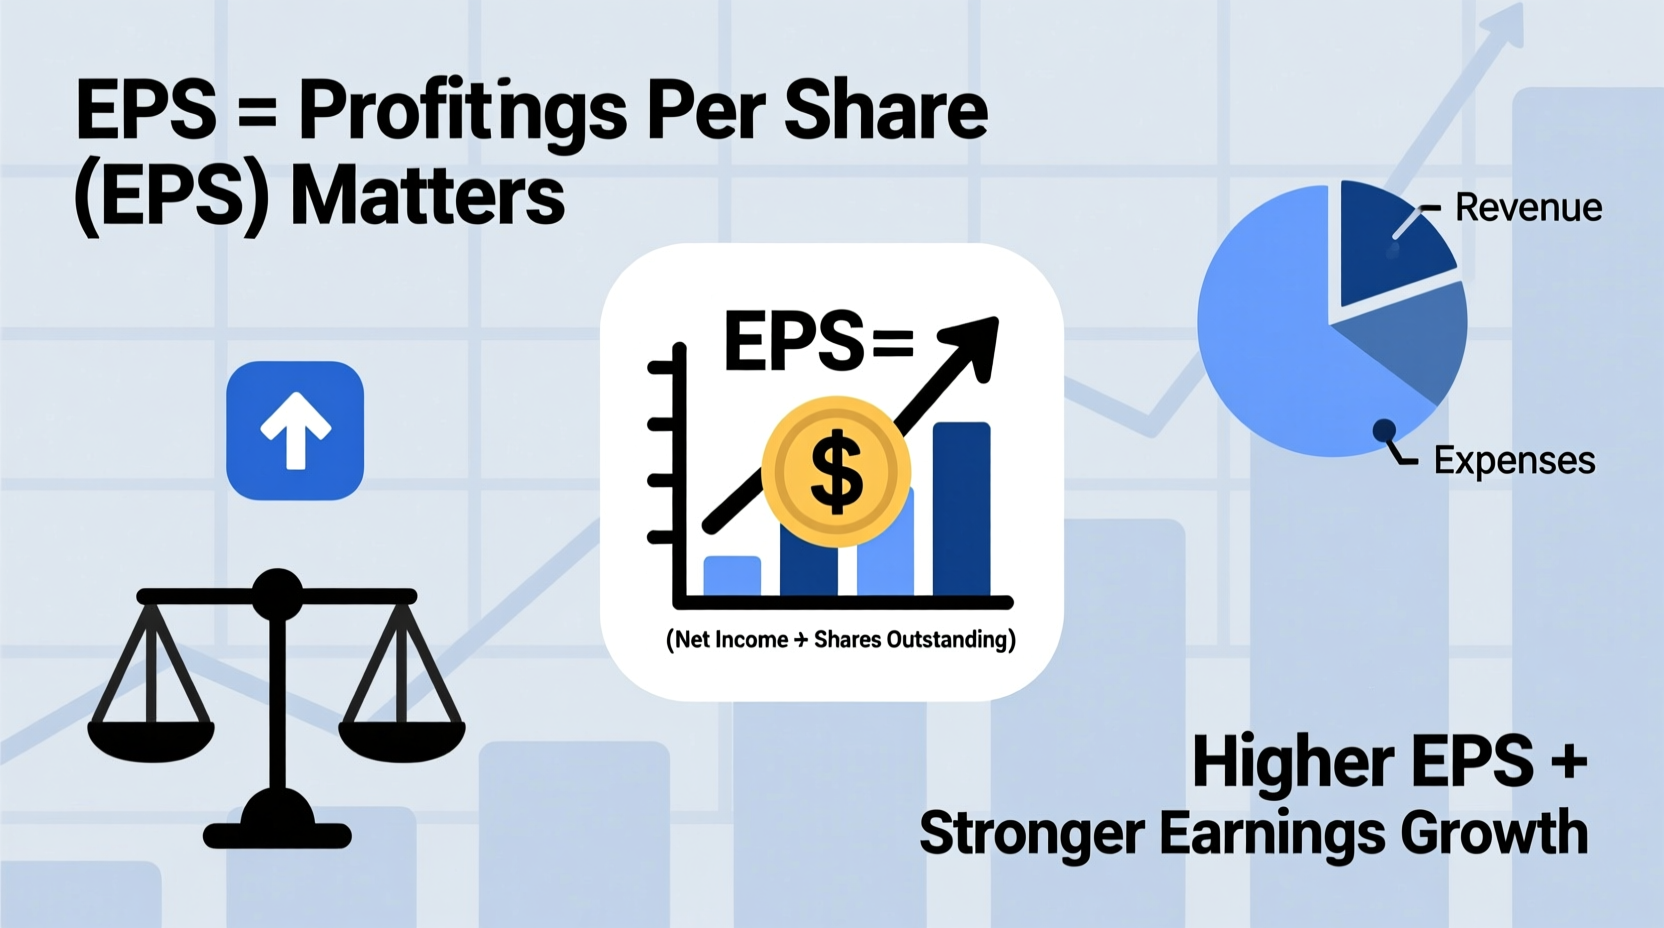
At its most basic level, EPS measures a company’s net income divided by the number of outstanding shares of common stock. The formula is simple:
EPS = (Net Income – Preferred Dividends) / Weighted Average Shares Outstanding
This calculation tells you how much money a company earned for each share investors hold. For example, if a company reports $5 million in net income, pays $500,000 in preferred dividends, and has 1 million shares outstanding, its EPS would be $4.50.
EPS can be reported in different forms:
- Basic EPS: Uses actual outstanding shares; commonly used for reporting.
- Diluted EPS: Includes potential shares from stock options, warrants, and convertible securities, offering a more conservative view.
- Trailing EPS: Based on the past 12 months of earnings.
- Forward EPS: An estimate of future earnings over the next 12 months.
Investors often look at both trailing and forward EPS to understand historical performance and projected growth.
Why EPS Matters to Investors
EPS is more than just a number—it’s a cornerstone of fundamental analysis. Here’s why it holds such significance:
1. Measures Profitability Efficiency
A rising EPS indicates that a company is generating more profit per share, which often reflects effective management, operational efficiency, or strong demand for its products. Consistent EPS growth over time is a hallmark of financially healthy companies.
2. Influences Stock Price
While not the sole driver, EPS plays a major role in determining stock valuation. When a company beats EPS expectations, its stock price often rises. Conversely, missing estimates can trigger sell-offs, regardless of revenue growth.
3. Used in Key Valuation Ratios
The price-to-earnings (P/E) ratio—one of the most widely used valuation tools—relies directly on EPS. A lower P/E may suggest a stock is undervalued, while a high P/E could signal overvaluation or high growth expectations.
4. Enables Peer Comparison
EPS allows investors to compare profitability across companies in the same industry, even if they differ in size. For instance, comparing the EPS of two tech firms helps determine which is more efficient at converting revenue into profit.
“EPS is the heartbeat of a company’s financial health. Without strong and growing earnings per share, even the most innovative business models struggle to deliver lasting shareholder value.” — James Reed, Portfolio Manager at Apex Capital Advisors
Limitations of EPS: What It Doesn’t Tell You
Despite its usefulness, EPS has notable limitations. Relying solely on EPS without context can lead to poor investment decisions.
1. Ignores Cash Flow
A company can report high EPS due to accounting practices but still face cash flow problems. For example, aggressive revenue recognition or delayed expense recording can inflate net income temporarily.
2. Susceptible to Manipulation
Companies may engage in share buybacks to reduce the number of outstanding shares, artificially boosting EPS without improving underlying profitability. Similarly, one-time gains (like asset sales) can distort quarterly results.
3. Doesn’t Reflect Debt Levels
Two companies with identical EPS may have vastly different debt burdens. A highly leveraged firm might appear profitable on paper but carry significant risk during economic downturns.
4. Varies by Industry Norms
EPS benchmarks differ widely across sectors. A utility company with stable but low EPS may be healthier than a speculative tech startup with negative EPS. Context is critical.
| Factor | EPS Insight | What EPS Misses |
|---|---|---|
| Profitability | Direct measure of earnings per share | Quality of earnings (cash vs. accrual) |
| Growth Trend | Quarter-over-quarter or year-over-year change | Sustainability of growth |
| Valuation Input | Used in P/E, PEG ratios | Market sentiment, macroeconomic factors |
| Shareholder Value | Indicates return per share | Dividend policy, capital allocation strategy |
How to Use EPS Effectively: A Step-by-Step Guide
To leverage EPS wisely, follow this structured approach:
- Collect Historical EPS Data: Pull at least four quarters of EPS to identify trends. Look for consistent growth rather than erratic spikes.
- Compare Against Expectations: Check consensus analyst estimates. Beating EPS forecasts often signals positive momentum.
- Analyze Diluted vs. Basic EPS: If diluted EPS is significantly lower, future share issuance could dilute your ownership.
- Calculate the P/E Ratio: Divide the current stock price by EPS to assess valuation relative to peers.
- Review Earnings Quality: Examine the income statement for one-time items or non-recurring gains that may inflate EPS.
- Monitor Share Count Changes: A shrinking share count may indicate buybacks, which support EPS growth but don’t always reflect operational improvement.
Real Example: Apple’s EPS Growth and Market Reaction
In Q2 2023, Apple reported a diluted EPS of $1.52, beating analyst expectations of $1.43. Despite flat year-over-year revenue, the EPS surprise was driven by strong iPhone margins and aggressive share buybacks, which reduced the total share count by nearly 5% year-over-year.
The market responded positively: Apple’s stock rose 7% in the following week. This case illustrates how EPS—even without top-line growth—can drive investor confidence when combined with disciplined capital management. However, critics noted that buyback-fueled EPS growth isn’t sustainable indefinitely, especially if operating profits stagnate.
Checklist: Evaluating EPS Before Investing
- ✅ Review at least four quarters of EPS data for trend consistency
- ✅ Compare diluted and basic EPS to assess dilution risk
- ✅ Check if EPS growth is driven by operations or share buybacks
- ✅ Cross-reference EPS with cash flow from operations
- ✅ Compare P/E ratio with industry peers
- ✅ Read management discussion in earnings calls for context behind the numbers
Frequently Asked Questions
Can a company have negative EPS?
Yes. A negative EPS means the company reported a net loss over the period. Startups and high-growth firms often have negative EPS initially. While not ideal, it’s acceptable if losses are strategic and revenue growth is strong.
Is higher EPS always better?
Not necessarily. A sudden spike in EPS could result from one-time gains or cost-cutting that harms long-term growth. Sustainable, steady EPS growth is more valuable than volatile peaks.
How does EPS affect dividends?
Companies typically pay dividends from earnings. A consistently high EPS increases the likelihood of dividend payments or increases. However, dividend policy also depends on management priorities and capital needs.
Conclusion: Make EPS Part of a Broader Strategy
Earnings per share is a powerful metric, but it’s most effective when used alongside other financial indicators. It provides clarity on profitability, supports valuation analysis, and helps track corporate performance over time. Yet, like any single metric, it should not dictate investment decisions in isolation. Smart investors combine EPS analysis with cash flow assessment, debt evaluation, and qualitative factors like leadership and market positioning.


 浙公网安备
33010002000092号
浙公网安备
33010002000092号 浙B2-20120091-4
Comments
No comments yet. Why don't you start the discussion?