
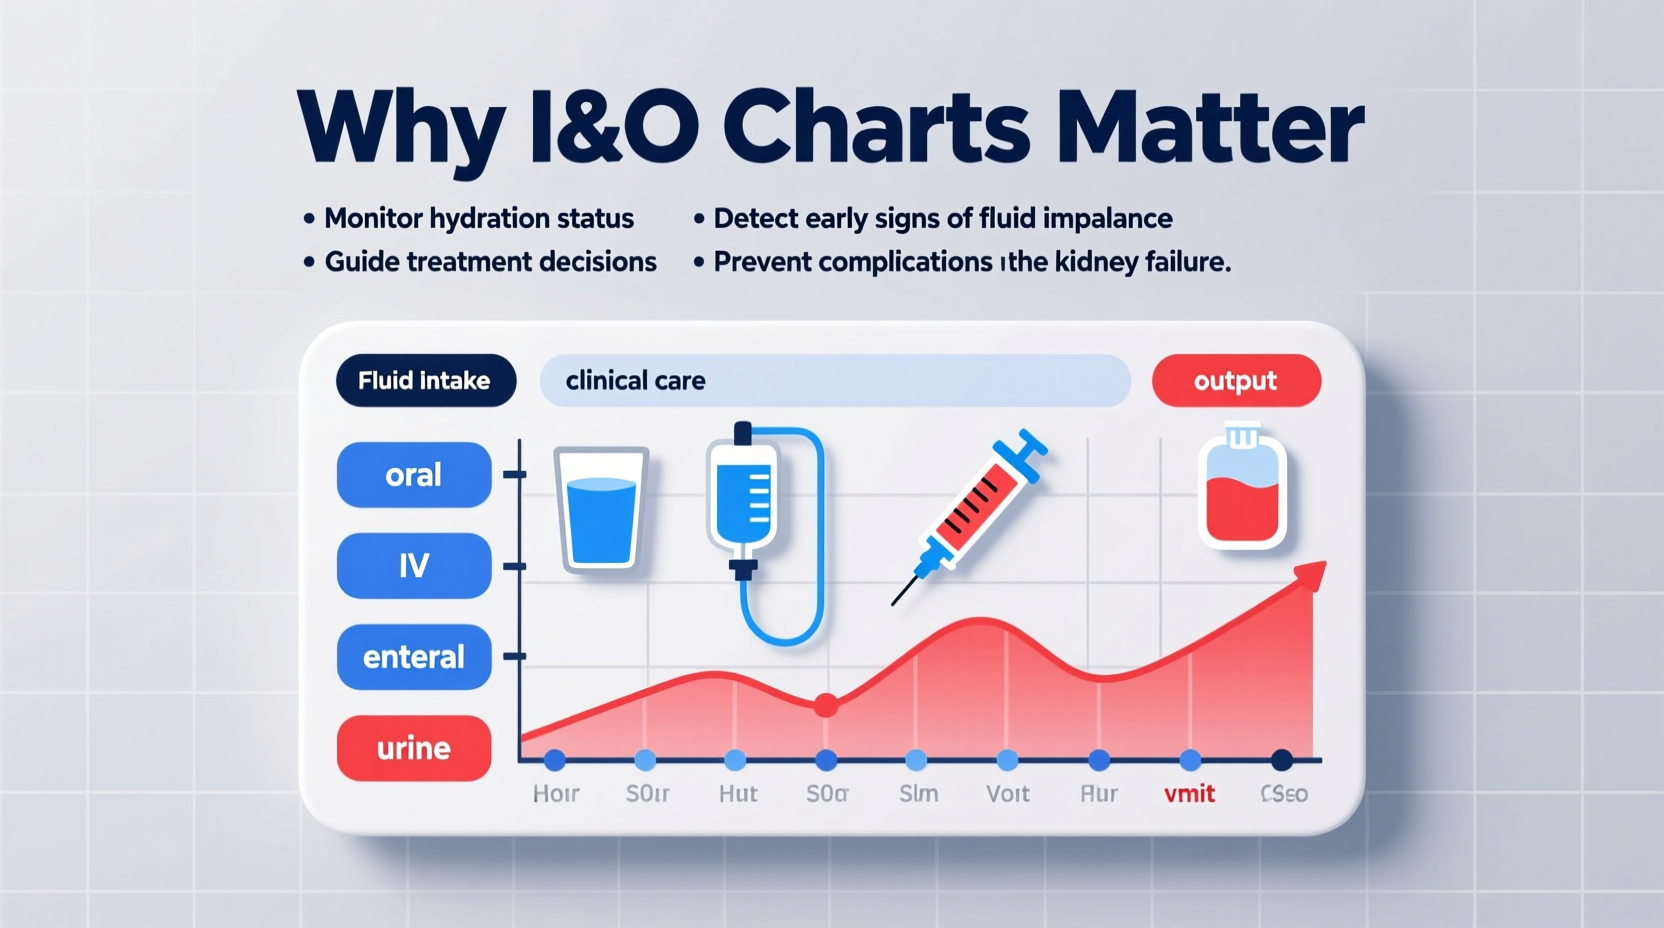
In clinical settings—from hospitals to long-term care facilities—accurate tracking of a patient’s fluid balance is not just routine; it's essential. Intake and output (I&O) charts serve as a foundational tool in assessing how much fluid a patient consumes versus how much they eliminate. While this may seem like a simple record-keeping task, the implications of these charts extend far beyond documentation. They influence diagnosis, guide treatment decisions, and can even prevent life-threatening complications. For healthcare providers and caregivers alike, understanding the significance of I&O monitoring is critical to delivering safe, effective care.
The Role of Fluid Balance in Human Physiology
Fluids are central to nearly every bodily function. They transport nutrients, regulate body temperature, support cellular metabolism, and facilitate waste removal. An adult typically needs about 2,000–2,500 mL of fluid per day to maintain equilibrium. When intake does not match output—or vice versa—the body risks dehydration or fluid overload, both of which can impair organ function.
The kidneys play a major role in maintaining this balance by adjusting urine concentration and volume. However, in patients with compromised cardiac, renal, or hepatic function, this self-regulation falters. That’s where I&O charts become indispensable: they offer a real-time window into how well the body is managing fluids.
“Monitoring intake and output isn’t just about numbers—it’s about recognizing subtle shifts that could signal a deteriorating condition before vital signs change.” — Dr. Lena Torres, Critical Care Nurse Practitioner
Key Reason 1: Early Detection of Medical Complications
One of the most crucial functions of an I&O chart is its ability to detect problems early. A sudden drop in urine output, for example, may be the first sign of acute kidney injury (AKI), especially in postoperative or critically ill patients. Similarly, unexplained increases in intake without corresponding output might suggest developing heart failure or liver cirrhosis with ascites.
Consider a patient recovering from abdominal surgery. Over two consecutive shifts, their urine output decreases from 40 mL/hour to 15 mL/hour, despite stable blood pressure. Without an accurate I&O record, this trend might go unnoticed until symptoms like confusion or elevated creatinine appear. But with consistent charting, the nursing team can alert the physician promptly, potentially preventing permanent kidney damage.
Key Reason 2: Guiding Clinical Decision-Making
Physicians rely on I&O data when making decisions about fluid resuscitation, diuretic therapy, or dialysis initiation. In intensive care units, these charts are often reviewed hourly during hemodynamic instability.
For instance, a patient in septic shock may require aggressive IV fluid administration. However, over-resuscitation can lead to pulmonary edema. By cross-referencing I&O trends with lung sounds, oxygen saturation, and imaging results, clinicians can determine whether continued fluids are beneficial or harmful.
Likewise, in patients with congestive heart failure, persistent positive fluid balance (more intake than output) may prompt a nurse to recommend adjusting diuretic dosage. These adjustments are only possible with reliable, up-to-date records.
Key Reason 3: Supporting Patient Safety and Preventing Errors
Misjudging fluid status can have serious consequences. Administering intravenous fluids to someone who is already fluid-overloaded can exacerbate respiratory distress. Conversely, restricting fluids in a dehydrated patient may accelerate kidney failure.
I&O charts act as a safeguard against such errors. They promote accountability among care teams and reduce reliance on memory or assumptions. When all staff members use the same standardized chart, communication improves during shift changes and interdisciplinary rounds.
Moreover, digital I&O tracking systems now integrate with electronic health records (EHRs), triggering alerts when imbalances exceed predefined thresholds. This technological advancement enhances patient safety through proactive intervention.
Key Reason 4: Enhancing Care for Vulnerable Populations
Certain patient groups are particularly sensitive to fluid imbalances, making I&O monitoring even more vital.
- Elderly patients: Age-related decline in kidney function and reduced thirst sensation increase the risk of dehydration.
- Pediatric patients: Children have higher metabolic rates and less fluid reserve, so small deficits can rapidly become dangerous.
- Patients with renal disease: Those on dialysis must adhere strictly to fluid restrictions; I&O charts help monitor compliance.
- Postoperative patients: Surgical stress and anesthesia affect fluid distribution, requiring close surveillance.
For these individuals, even minor inaccuracies in documentation can lead to significant clinical setbacks.
Mini Case Study: Identifying Silent Deterioration
A 72-year-old male was admitted for hip replacement surgery. On the second post-op day, he appeared stable—vitals within normal limits, ambulating with assistance. However, his I&O chart revealed a cumulative positive balance of +1,800 mL over 24 hours due to high IV fluid administration and declining urine output.
The night nurse flagged the discrepancy during handoff. A bedside ultrasound confirmed early signs of volume overload. The care team adjusted the IV rate and administered a low-dose diuretic. Within 12 hours, urine output improved, and the patient avoided admission to the ICU.
This case underscores how diligent I&O tracking can catch issues before they become emergencies—even when outward signs are absent.
Best Practices for Accurate I&O Documentation
To maximize the value of intake and output charts, healthcare professionals should follow evidence-based practices:
- Measure all sources of intake: oral, enteral, parenteral, and IV medications.
- Record all forms of output: urine, vomitus, drainage (e.g., NG suction, wound drains), and stool (if diarrhea is severe).
- Use standardized units (mL) consistently across shifts.
- Include time-stamped entries to identify trends.
- Verify container measurements rather than estimating.
- Communicate significant changes during handoffs and rounds.
Do’s and Don’ts of I&O Monitoring
| Do | Don’t |
|---|---|
| Include ice chips (count as half the melted volume) | Ignore small outputs like emesis or wound drainage |
| Document timing and volume precisely | Estimate amounts without measuring |
| Report trends, not just isolated values | Delay documentation until end of shift |
| Involve patients in tracking oral intake when possible | Assume insensible losses aren't relevant |
Frequently Asked Questions
How often should intake and output be recorded?
Frequency depends on the patient’s condition. Critically ill patients may require hourly or 2-hourly recording, while stable patients are typically assessed every 8 or 12 hours. Institutional policies usually define specific protocols based on acuity level.
What counts as intake and output?
Intake includes all fluids consumed: oral drinks, tube feedings, IV fluids, blood products, and flushes. Output includes urine, vomit, diarrhea, chest tube drainage, surgical suction, and significant perspiration (in rare cases). Insensible losses (e.g., breathing, skin evaporation) are not directly measured but considered in overall assessment.
Can I&O charts replace lab tests?
No. While I&O charts provide valuable trend data, they complement—not replace—laboratory assessments like serum electrolytes, BUN, creatinine, and hematocrit. Together, they form a comprehensive picture of fluid and renal status.
Conclusion: Turning Data Into Action
Intake and output charts are far more than administrative paperwork—they are dynamic tools that reflect a patient’s physiological story. When used correctly, they empower clinicians to intervene early, personalize treatment, and enhance outcomes. In an era where precision medicine is paramount, something as fundamental as fluid tracking remains one of the most powerful indicators of health.
Every milliliter documented contributes to safer care. Whether you're a nurse at the bedside, a physician reviewing charts, or a caregiver supporting a loved one, understanding the importance of I&O monitoring transforms routine tasks into acts of vigilance. Start treating these records not as chores, but as critical diagnostics—and watch how small details make a big difference.


 浙公网安备
33010002000092号
浙公网安备
33010002000092号 浙B2-20120091-4
Comments
No comments yet. Why don't you start the discussion?