
Gantt charts have been a cornerstone of project management since their creation by Henry Gantt in the early 20th century. Despite the rise of agile methodologies and digital tools, they remain one of the most effective ways to visualize project timelines, track progress, and coordinate teams. Whether you're managing a software rollout, a construction project, or a marketing campaign, understanding why use Gantt charts can significantly improve your ability to deliver on time and within scope.
At its core, a Gantt chart is a horizontal bar chart that maps out tasks against time. Each task is represented as a bar, with its length indicating duration. Dependencies, milestones, and resource allocation are also displayed, giving a comprehensive view of the entire project lifecycle. But beyond their visual appeal, Gantt charts offer strategic advantages that help teams stay aligned, anticipate risks, and maintain momentum.
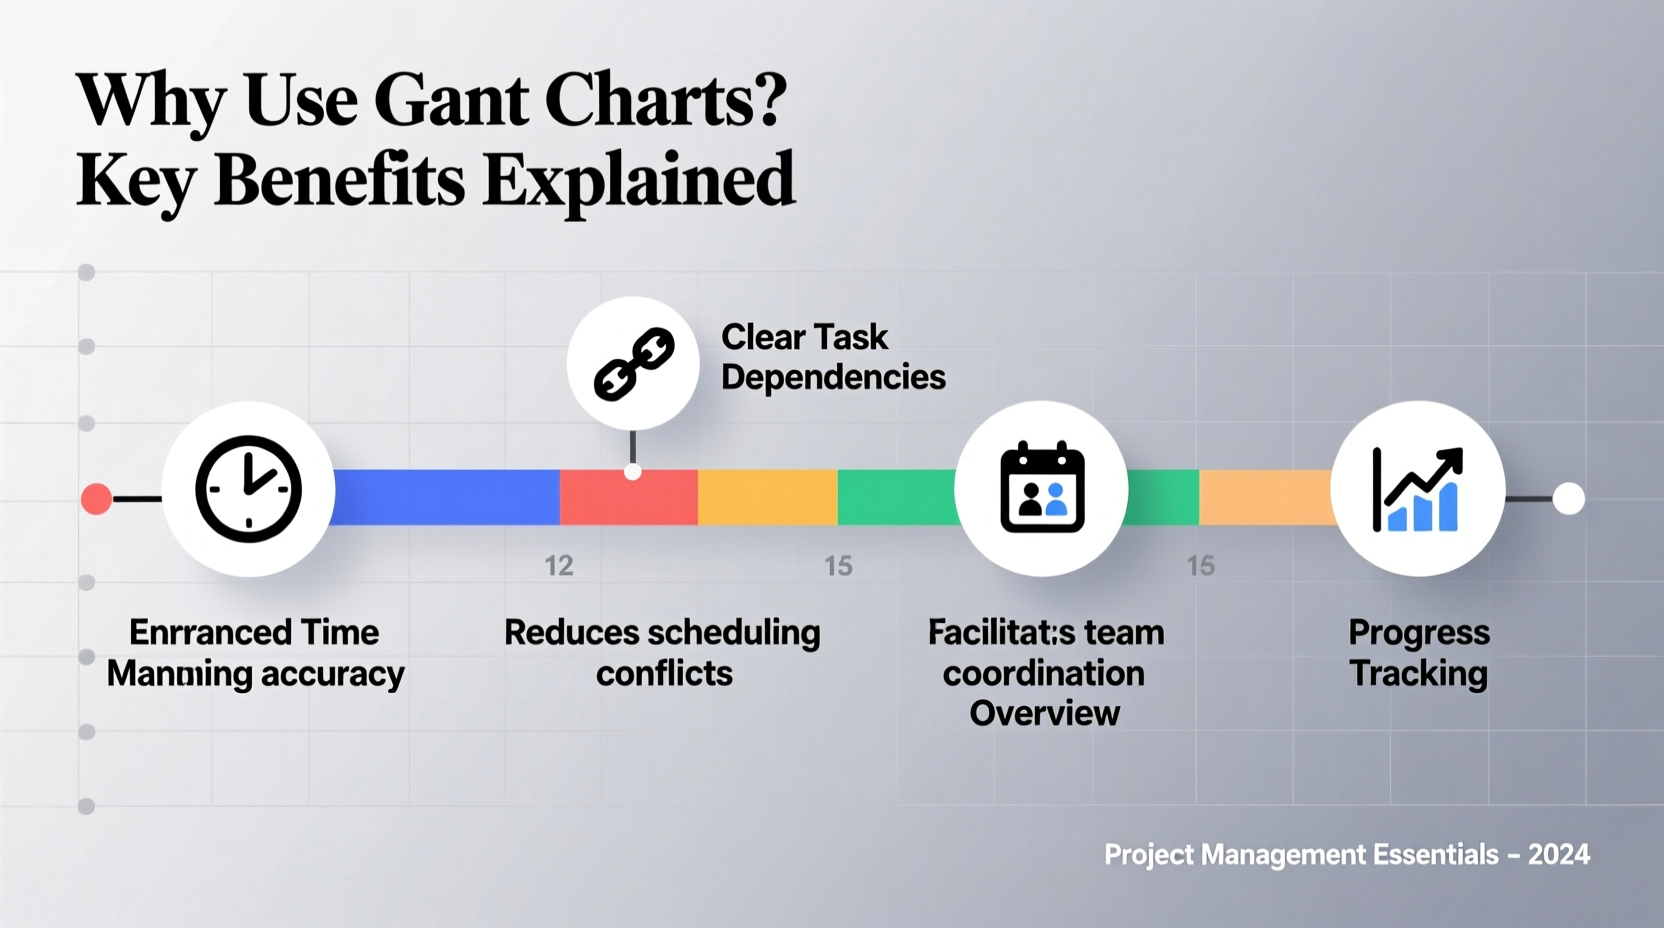
Enhanced Project Visualization
One of the primary reasons to use Gantt charts is their ability to transform complex project data into an intuitive visual format. Instead of sifting through spreadsheets or endless email threads, stakeholders can instantly see what needs to be done, when it’s due, and who is responsible.
This level of clarity reduces confusion and ensures everyone—from team members to executives—shares the same understanding of the project’s status. For example, overlapping bars immediately reveal potential scheduling conflicts, while gaps highlight underutilized time that could be optimized.
Improved Time Management and Scheduling
Gantt charts force project managers to break down large initiatives into manageable tasks with defined start and end dates. This structured approach prevents vague timelines like “start soon” or “finish eventually,” replacing them with concrete deadlines.
By assigning durations and sequencing tasks logically, teams can identify the critical path—the sequence of tasks that directly impact the project’s completion date. Managing this path effectively allows leaders to focus attention where delays would be most damaging.
Moreover, Gantt charts support forward and backward planning. You can work from a fixed deadline backward to allocate time appropriately, or build forward from the current date to estimate realistic delivery dates.
Real-World Example: Website Redesign Project
A mid-sized company planned a complete website redesign involving design, development, content creation, and SEO optimization. Without a clear timeline, initial estimates suggested a six-week turnaround, but conflicting priorities caused delays.
After implementing a Gantt chart, the team discovered that content writing was scheduled to begin only after design approval—creating a bottleneck. By adjusting the schedule to allow content drafting in parallel with early wireframing, they reduced total project time by 11 days without increasing resources.
“Gantt charts don’t just show when things happen—they reveal how everything connects. That visibility is what turns chaos into coordination.” — Laura Simmons, Senior Project Manager at TechFlow Solutions
Better Resource Allocation and Team Coordination
Projects often fail not because of poor ideas, but because of misallocated people or overburdened team members. Gantt charts integrate resource planning by showing who is assigned to each task and when.
When multiple tasks overlap and require the same person, the chart exposes overcommitment before it becomes a crisis. Managers can then reassign work, adjust timelines, or bring in additional support proactively.
This transparency fosters accountability. Team members see their responsibilities in context, understand how their work affects others, and are more likely to meet deadlines when their contributions are visibly mapped.
Do’s and Don’ts of Resource Planning with Gantt Charts
| Do | Don’t |
|---|---|
| Assign specific team members to tasks | Use generic labels like “team” or “devs” |
| Track working hours alongside task duration | Assume all days are equally productive |
| Color-code roles or departments | Mix assignments without labeling |
| Update availability for leaves or part-time roles | Treat calendars as static |
Tracking Progress and Identifying Risks Early
A live Gantt chart acts as a project dashboard. As tasks are completed, bars can be shaded to reflect actual progress versus planned timelines. This real-time tracking helps identify deviations quickly—whether a task is running late, ahead of schedule, or blocked by dependencies.
For instance, if Task B depends on Task A but Task A is delayed, the Gantt chart visually signals that Task B will also be pushed back unless action is taken. This early warning enables mitigation strategies such as fast-tracking, crashing the schedule, or renegotiating deliverables.
In regulated industries like construction or pharmaceuticals, this level of traceability is essential for audits and compliance reporting. Historical Gantt data can also inform future projects by revealing common delay patterns or inefficiencies.
Facilitating Communication and Stakeholder Alignment
One of the hidden benefits of Gantt charts is their role as a communication tool. Executives, clients, and cross-functional partners often lack the time or technical background to interpret detailed project documentation. A well-designed Gantt chart bridges that gap.
With a single glance, stakeholders can grasp the big picture: major phases, upcoming milestones, and current status. This shared reference point reduces misunderstandings and aligns expectations. It's especially valuable during status meetings, where discussions can pivot around the chart rather than abstract updates.
Additionally, many modern project management tools (like Microsoft Project, Asana, or ClickUp) allow sharing interactive Gantt views with read-only access, enabling transparency without risking accidental edits.
Step-by-Step Guide to Creating an Effective Gantt Chart
- Define project scope and objectives – Know what success looks like before mapping tasks.
- List all key tasks and subtasks – Break the project into actionable components.
- Estimate durations – Use historical data or expert input for realistic timeframes.
- Sequence tasks logically – Identify which tasks must finish before others begin.
- Assign resources – Allocate team members and note availability constraints.
- Set milestones – Mark critical checkpoints like approvals or launches.
- Build the chart using software – Tools like Smartsheet or Monday.com automate much of the layout.
- Review and adjust regularly – Update progress and adapt to changes as needed.
Frequently Asked Questions
Are Gantt charts only useful for large projects?
No. While they’re powerful for complex initiatives, Gantt charts are equally beneficial for small projects. Even a three-week campaign with five tasks can benefit from visual scheduling to avoid missed deadlines and ensure smooth handoffs.
Can Gantt charts be used in Agile environments?
Yes, with adaptation. Traditional Gantt charts emphasize fixed timelines, which contrasts with Agile’s iterative nature. However, some teams use rolling-wave Gantt charts that detail only the next sprint or two, combining long-term vision with short-term flexibility.
What’s the difference between a Gantt chart and a Kanban board?
Kanban boards focus on workflow states (To Do, In Progress, Done) and are ideal for continuous delivery. Gantt charts emphasize time and dependencies, making them better suited for projects with strict deadlines and interdependent tasks. The best approach often combines both: Gantt for planning, Kanban for execution.
Checklist: Is Your Gantt Chart Effective?
- ✅ All major tasks are included and clearly named
- ✅ Start and end dates are realistic and documented
- ✅ Dependencies between tasks are mapped
- ✅ Resources are assigned to each task
- ✅ Milestones mark key deliverables or decisions
- ✅ Color coding improves readability
- ✅ Chart is updated regularly and shared with stakeholders
Final Thoughts: Why Use Gantt Charts? Because Clarity Drives Success
The value of Gantt charts lies not in their complexity, but in their clarity. They turn abstract plans into tangible roadmaps, expose hidden risks, and create alignment across teams and leadership. In an era of information overload, having a single source of truth for project timing and responsibility is not just helpful—it’s essential.
Whether you're leading a two-person initiative or a multinational rollout, integrating Gantt charts into your planning process brings structure, accountability, and confidence. The effort invested in building one pays dividends in smoother execution, fewer surprises, and higher success rates.


 浙公网安备
33010002000092号
浙公网安备
33010002000092号 浙B2-20120091-4
Comments
No comments yet. Why don't you start the discussion?