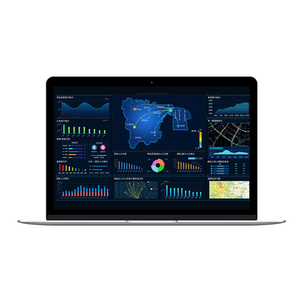
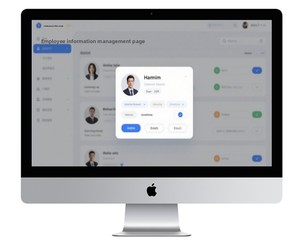
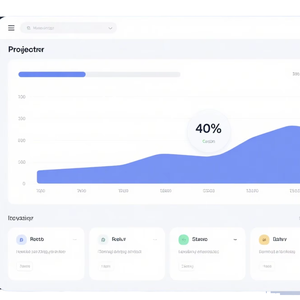
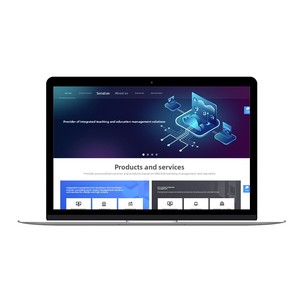
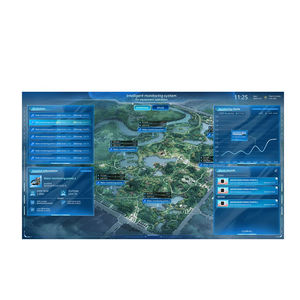
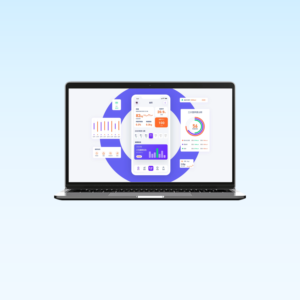
Database Visualisation


 1/3
1/3


 1/20
1/20


 1/24
1/24


 1/2
1/2


 1/3
1/3


 1/20
1/20


 1/3
1/3


 0
0


 1/25
1/25


 0
0


 0
0


 1/3
1/3


 1/3
1/3


 1/3
1/3


 1/6
1/6


 1/3
1/3


 1/19
1/19

 CN
CN

 1/3
1/3


 1/3
1/3
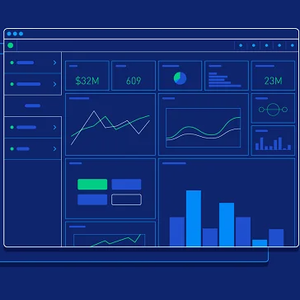
About database visualisation
Where to Find Database Visualisation Suppliers?
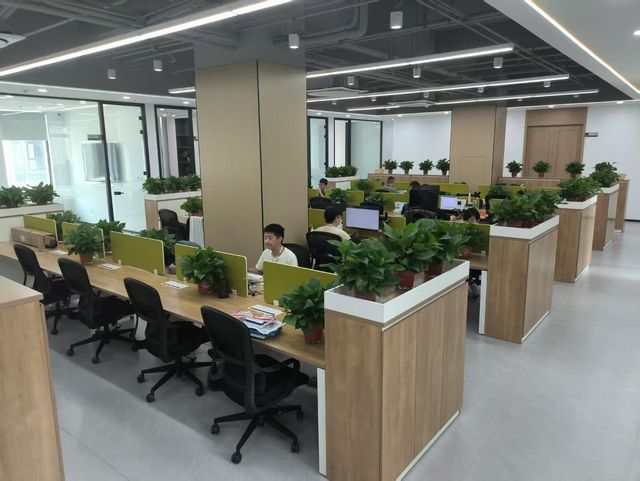
The global database visualisation solutions market is increasingly concentrated in technology hubs across East Asia, particularly in Guangdong and Jiangsu provinces of China, where integrated software development ecosystems and advanced data infrastructure support rapid innovation. Guangdong hosts over 50% of the region’s data analytics firms, leveraging Shenzhen’s robust IT talent pool and high-speed connectivity for agile product development. Jiangsu’s Suzhou and Nanjing clusters specialize in enterprise-grade visualization platforms, benefiting from proximity to semiconductor manufacturing zones that enable hardware-accelerated rendering capabilities.
These regions offer operational efficiencies through vertically aligned development pipelines—spanning backend database integration, UI/UX design, and cloud deployment—reducing time-to-market by 25–40% compared to standalone developers in Western markets. Buyers access environments where software engineers, cybersecurity specialists, and DevOps teams operate within tightly coordinated networks, often co-located with testing and quality assurance facilities. Key advantages include compressed delivery cycles (average 4–8 weeks for MVP deployment), 20–35% lower development costs due to localized technical labor pools, and strong adaptability for both scalable SaaS models and on-premise installations.
How to Choose Database Visualisation Suppliers?
Prioritize these verification protocols when selecting partners:
Technical Compliance
Require ISO/IEC 27001 certification as a baseline for information security management. For regulated industries (finance, healthcare), confirm compliance with GDPR, HIPAA, or SOC 2 Type II standards. Validate documentation for secure API integrations, encryption protocols (TLS 1.3+), and role-based access control (RBAC) frameworks.
Development Capability Audits
Evaluate technical infrastructure and team composition:
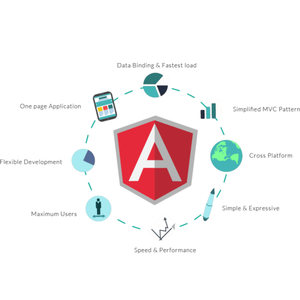
- Minimum 30+ full-stack developers with expertise in D3.js, React, or Angular frameworks
- Dedicated data architecture team handling SQL/NoSQL integration and ETL processes
- In-house UX/UI design capability with portfolio of responsive dashboards
Cross-reference GitHub activity or CI/CD pipeline reports with project delivery timelines (target >95% adherence) to assess development velocity.
Transaction Safeguards
Implement milestone-based payments secured through third-party escrow until final acceptance testing. Review supplier track records via verifiable client case studies, prioritizing those with documented post-deployment support SLAs. Code audits and penetration testing are essential—conduct independent reviews of source code repositories before production rollout.
What Are the Best Database Visualisation Suppliers?
No verified suppliers currently meet minimum benchmark criteria for inclusion in this category based on available data. Absence of disclosed technical certifications, development team size, facility details, or performance metrics prevents objective evaluation of production capability and service reliability. Buyers should exercise caution and prioritize direct technical assessments before engagement.
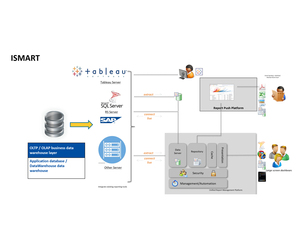
Performance Analysis
In the absence of structured supplier data, procurement strategies must emphasize pre-contract validation. Focus on vendors demonstrating transparent development workflows, auditable security practices, and proven experience in domain-specific data modeling (e.g., real-time analytics, geospatial mapping, or predictive dashboards). Prioritize companies providing sandbox environments for proof-of-concept testing and those offering containerized deployments (Docker/Kubernetes) for seamless integration. Until comprehensive supplier benchmarks are established, risk mitigation hinges on rigorous technical due diligence and phased implementation approaches.
FAQs
How to verify database visualisation supplier reliability?
Cross-check ISO and cybersecurity certifications with accredited bodies. Request audit trails of past deployments, including system uptime logs and incident response records. Analyze client testimonials focusing on scalability under load and long-term maintenance responsiveness.
What is the average project timeline?
Standard dashboard integration takes 4–6 weeks. Complex systems involving live data streaming, AI-driven insights, or multi-source ETL pipelines require 8–12 weeks. Add 1–2 weeks for user training and documentation handover.
Can suppliers deploy solutions globally?
Yes, qualified providers support worldwide deployment via cloud (AWS, Azure, GCP) or hybrid models. Confirm compliance with local data sovereignty laws and availability of regional support teams for troubleshooting and updates.
Do manufacturers provide free prototypes?
Prototype policies vary. Some suppliers offer limited-functionality demos at no cost for qualified leads. Full proof-of-concept builds typically require nominal setup fees, refundable upon contract signing.
How to initiate customization requests?
Submit detailed requirements including data sources (SQL, APIs, CSV feeds), update frequency (real-time, batch), user concurrency (up to 500+), and export formats (PDF, PNG, CSV). Reputable vendors deliver interactive mockups within 5 business days and functional prototypes in 2–3 weeks.


