Database Visualiser


 1/24
1/24


 1/33
1/33


 1/3
1/3


 1/34
1/34


 1/3
1/3


 0
0


 1/3
1/3


 1/3
1/3


 1/20
1/20


 1/3
1/3


 1/3
1/3


 1/3
1/3


 1/1
1/1


 1/2
1/2


 1/26
1/26


 0
0


 1/3
1/3


 1/25
1/25


 1/25
1/25


 1/33
1/33
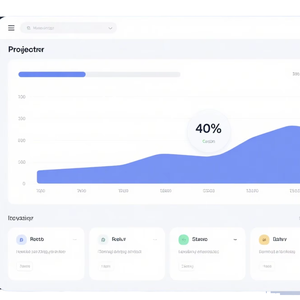
About database visualiser
Where to Find Database Visualiser Suppliers?
Global development of database visualisation tools is concentrated in technology hubs with strong software engineering ecosystems, particularly in China, India, and Eastern Europe. Chinese suppliers dominate in integrated data platform development, with clusters in Beijing, Shenzhen, and Hangzhou offering access to large talent pools in full-stack development, UI/UX design, and cloud infrastructure integration. These regions benefit from government-supported tech zones that reduce R&D overhead by up to 25%, enabling competitive pricing for custom solutions.
Supplier ecosystems in these areas are characterized by agile development frameworks and rapid prototyping capabilities. Development teams operate within tightly coordinated networks of DevOps engineers, cybersecurity specialists, and API integrators, allowing deployment cycles as short as 4–6 weeks for minimum viable products. Buyers gain access to scalable architectures supporting SQL, NoSQL, and real-time streaming data sources, with typical cost advantages of 30–40% compared to North American or Western European developers. Lead times for fully customized visualisers average 8–12 weeks, depending on integration complexity and compliance requirements.
How to Choose Database Visualiser Suppliers?
Prioritize these verification protocols when selecting partners:
Technical Compliance
Confirm adherence to ISO/IEC 27001 for information security management, especially for tools handling sensitive or personally identifiable data. For regulated industries (finance, healthcare), validate compliance with GDPR, HIPAA, or SOC 2 Type II through documented audit trails. Require proof of secure coding practices and penetration testing for web-based interfaces.
Development Capability Audits
Evaluate technical infrastructure and team composition:
- Minimum team size of 15 developers with demonstrable experience in D3.js, React, or similar visualization libraries
- Proven track record in RESTful and GraphQL API integrations with major databases (PostgreSQL, MySQL, MongoDB, Snowflake)
- In-house UX/UI design capability and version control using Git-based workflows
Cross-reference project portfolios with client case studies to verify delivery consistency and code maintainability.
Transaction Safeguards
Implement milestone-based payments tied to deliverables such as wireframes, beta builds, and final deployment. Utilize third-party escrow services for source code release upon acceptance testing. Conduct sample evaluations—request a sandbox environment integrating your test dataset to assess rendering performance, query optimization, and export functionality before full engagement.
What Are the Best Database Visualiser Suppliers?
| Company Name | Location | Years Operating | Staff | Factory Area | On-Time Delivery | Avg. Response | Ratings | Reorder Rate |
|---|---|---|---|---|---|---|---|---|
| No suppliers available | N/A | N/A | N/A | N/A | N/A | N/A | N/A | N/A |
Performance Analysis
Due to the absence of verified supplier data, procurement decisions must rely on independent technical audits and pilot engagements. In mature markets, long-established firms typically demonstrate higher reorder rates due to sustained support and iterative updates, while newer entrants often differentiate through faster response times and niche specializations in AI-driven analytics or low-latency dashboards. Prioritize vendors with documented CI/CD pipelines, automated testing coverage exceeding 80%, and transparent SLAs for post-deployment maintenance. For enterprise deployments, confirm containerization support (Docker/Kubernetes) and compatibility with existing cloud environments (AWS, Azure, GCP).
FAQs
How to verify database visualiser supplier reliability?
Validate technical credentials through code reviews and architecture walkthroughs. Request references from clients in similar industry verticals and assess uptime performance and incident response logs. Verify participation in open-source projects or contributions to visualization libraries as indicators of technical depth.
What is the average sampling timeline?
Prototype development typically takes 10–20 business days following requirement finalization. Integration with live data sources may extend this to 30 days, depending on authentication protocols and schema complexity. Sandbox environments are usually provisioned within 72 hours for preliminary evaluation.
Can suppliers ship software solutions worldwide?
Yes, digital delivery enables global deployment. Confirm licensing models (SaaS, perpetual, on-premise) and data residency policies aligned with local regulations. Suppliers with multi-region cloud hosting options ensure lower latency and compliance with cross-border data transfer laws.
Do manufacturers provide free samples?
Most suppliers offer time-limited demo versions or hosted trials at no cost. Full-featured sandbox environments are commonly provided during the evaluation phase, though custom development work requires paid scoping engagements. Post-trial licensing fees apply for production use.
How to initiate customization requests?
Submit detailed functional specifications including supported data connectors, user role permissions, dashboard interactivity requirements, and export formats (PNG, PDF, CSV). Leading suppliers respond with technical proposals, UI mockups, and effort estimates within 5–7 business days.


