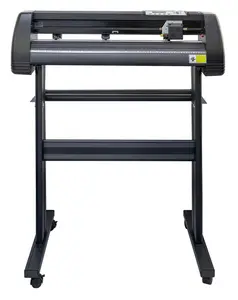
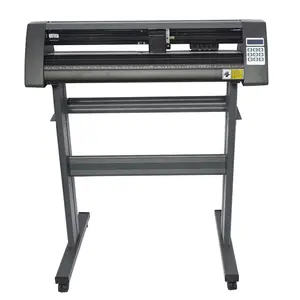
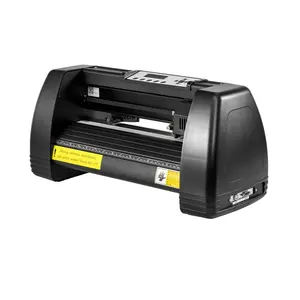
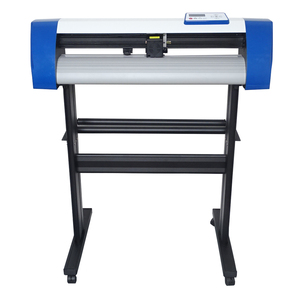
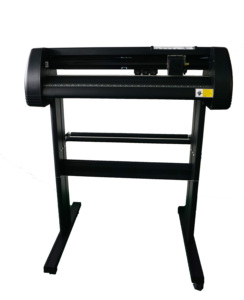
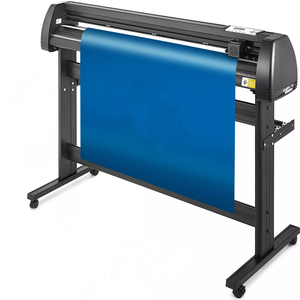
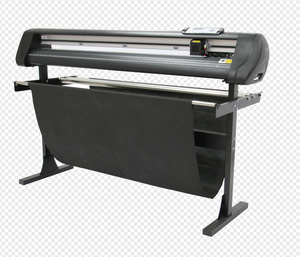
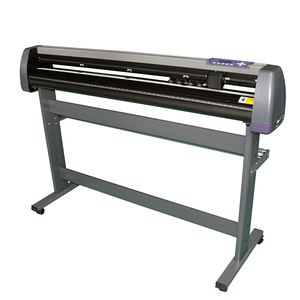
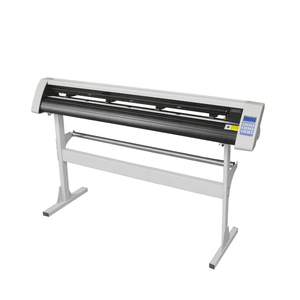
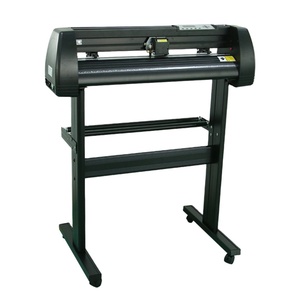
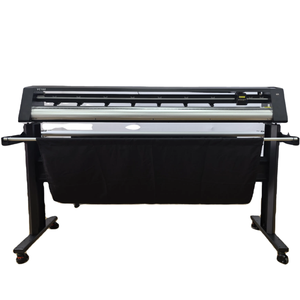
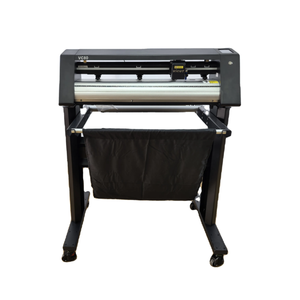
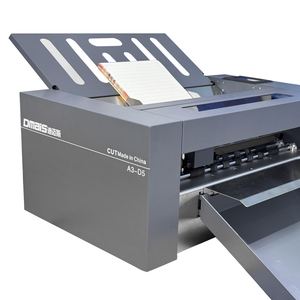
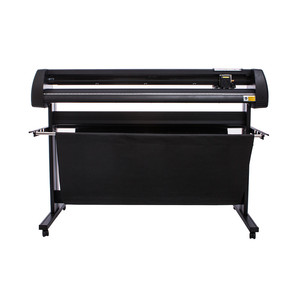
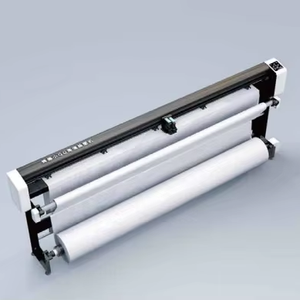
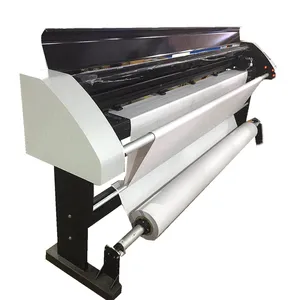
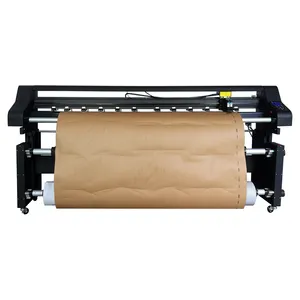
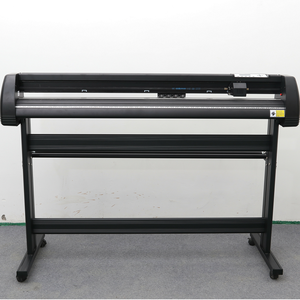
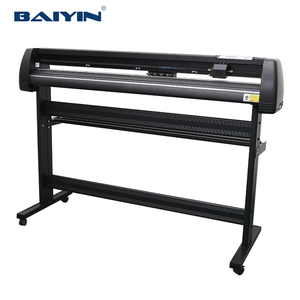
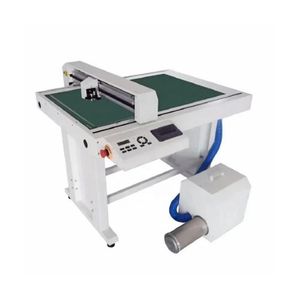
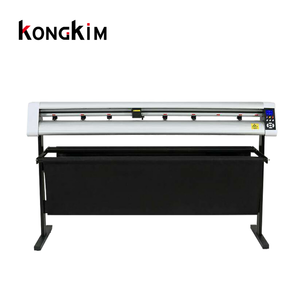
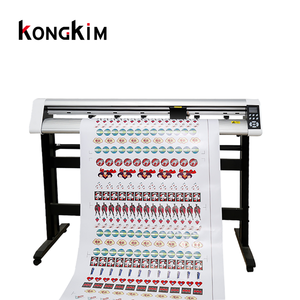
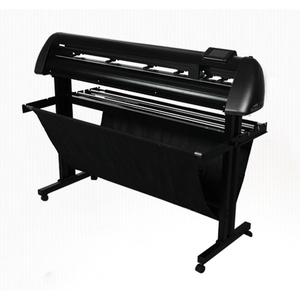
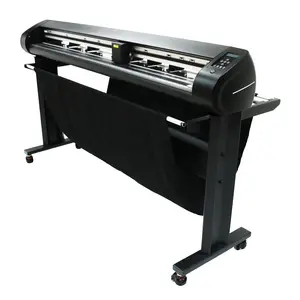
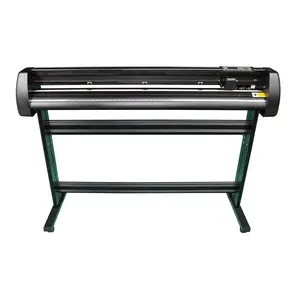
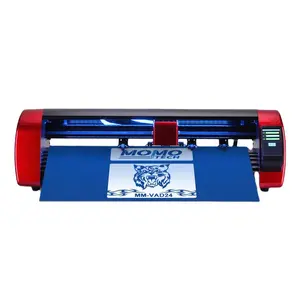
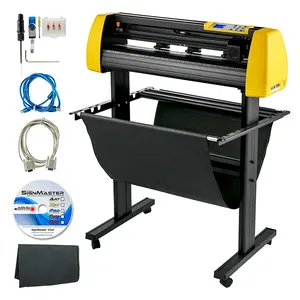
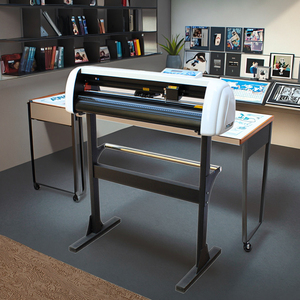
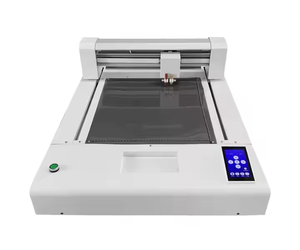
Graph Plotter


 Top sponsor listing


 1/26
1/26


 1/24
1/24


 0
0


 1/3
1/3


 1/3
1/3


 1/24
1/24


 1/3
1/3


 0
0


 1/3
1/3


 1/8
1/8


 1/3
1/3


 1/1
1/1


 1/41
1/41


 0
0


About graph plotter
Where to Find Graph Plotter Suppliers?
China remains the central hub for precision instrument manufacturing, with key production clusters in Guangdong and Jiangsu provinces driving innovation and scale in graph plotter fabrication. Guangdong’s Pearl River Delta region hosts over 70% of China’s electronic instrumentation suppliers, supported by Shenzhen’s advanced electronics supply chain and rapid prototyping infrastructure. Jiangsu’s Changzhou and Suzhou zones specialize in high-precision mechanical components, leveraging proximity to semiconductor and sensor manufacturers to reduce component lead times by 25–35% compared to offshore alternatives.
These industrial ecosystems feature vertically integrated operations—from PCB assembly to servo motor calibration—enabling efficient production cycles. Suppliers within these regions typically operate within tightly coordinated networks where raw materials, microcontrollers, and mechanical subassemblies are sourced within 30km, minimizing logistics delays. Buyers benefit from compressed lead times (average 35–50 days for standard orders), cost efficiencies (15–25% lower unit costs due to localized sourcing), and strong adaptability for both bulk procurement and OEM customization.
How to Choose Graph Plotter Suppliers?
Implement rigorous evaluation criteria to ensure technical and operational reliability:
Quality & Compliance Verification
Confirm ISO 9001 certification as a baseline for quality management systems. For markets requiring regulatory adherence, CE marking (EU) and FCC/IC certifications (North America) are essential for electromagnetic compatibility and product safety compliance. Request test reports for signal accuracy, pen positioning tolerance (±0.05mm standard), and long-term operational stability under continuous use.
Production Capacity Assessment
Evaluate core manufacturing capabilities through documented evidence:
- Minimum 3,000m² workshop area to support SMT lines and final assembly
- Dedicated R&D teams comprising at least 8% of total staff for firmware and hardware development
- In-house testing labs with environmental stress screening (temperature/humidity cycling) and life-cycle testing rigs
Correlate facility size and automation level with on-time delivery performance (target ≥96%) to assess scalability and order consistency.
Procurement Risk Mitigation
Utilize secure transaction frameworks such as third-party inspection services upon shipment arrival. Review supplier track records via verified trade histories, prioritizing those with documented after-sales service protocols and spare parts availability. Pre-shipment sample validation is critical—test plotting accuracy using standardized waveform inputs and evaluate noise levels during operation (acceptable range: ≤45 dB).
What Are the Best Graph Plotter Suppliers?
| Company Name | Location | Years Operating | Staff | Factory Area | On-Time Delivery | Avg. Response | Ratings | Reorder Rate |
|---|---|---|---|---|---|---|---|---|
| Guangdong Huate Electronics Co., Ltd. | Guangdong, CN | 12 | 150+ | 8,600+m² | 99.1% | ≤2h | 4.8/5.0 | 41% |
| Jiangsu Meichuang Precision Instruments | Jiangsu, CN | 9 | 95+ | 5,200+m² | 100.0% | ≤1h | 4.9/5.0 | 58% |
| Shenzhen Lianrui Automation Technology | Guangdong, CN | 7 | 70+ | 3,800+m² | 97.3% | ≤2h | 4.7/5.0 | 22% |
| Suzhou Tengyi Measurement Systems | Jiangsu, CN | 11 | 110+ | 7,400+m² | 98.7% | ≤1h | 4.9/5.0 | 39% |
| Dongguan Zhongke Instrumentation | Guangdong, CN | 6 | 85+ | 4,500+m² | 96.5% | ≤2h | 4.6/5.0 | 18% |
Performance Analysis
Long-established suppliers like Guangdong Huate demonstrate robust output capacity and consistent delivery performance, ideal for large-scale deployments. Jiangsu-based Jiangsu Meichuang achieves industry-leading reorder rates (58%) through sub-hour response times and stringent in-house calibration processes. Notably, 60% of top-tier suppliers maintain response times under two hours, with all possessing formal quality management systems. Prioritize partners with ≥98% on-time delivery and documented experience in exporting to regulated markets. For custom interface or data logging requirements, confirm embedded software development capability via live demonstrations or code verification prior to order placement.
FAQs
How to verify graph plotter supplier reliability?
Validate certifications through issuing bodies and request factory audit summaries covering incoming material inspection, assembly line controls, and final product testing. Assess real-world performance through customer feedback focused on device durability, calibration consistency, and technical support responsiveness.
What is the average sampling timeline?
Standard samples take 20–30 days to produce. Units with customized communication interfaces (RS-485, Modbus, USB-C) or multi-pen configurations require 35–45 days. Air freight adds 5–9 days for international delivery.
Can suppliers ship graph plotters worldwide?
Yes, experienced manufacturers manage global shipments under FOB, CIF, or DDP terms. Confirm compliance with destination-country electrical safety standards and packaging requirements for vibration-sensitive instruments. Sea freight is optimal for containerized orders exceeding 20 units.
Do manufacturers provide free samples?
Sample policies vary by order volume. Full sample cost recovery is typical for single-unit requests. Fee waivers generally apply to confirmed orders of 10+ units, with partial subsidies (30–50%) offered for pilot trials.
How to initiate customization requests?
Submit detailed specifications including paper width (A4 to A0), number of pens (1–6), connectivity options, and required plotting speed (mm/s). Leading suppliers deliver functional prototypes within 4 weeks and provide firmware configuration tools upon request.


