
Understanding whether a graph represents a function is a foundational concept in algebra and calculus. It's not just about memorizing rules—it’s about developing an intuitive sense of how inputs and outputs relate. The vertical line test is a simple yet powerful tool that helps determine whether a given graph defines a function. This guide breaks down the concept, explains how to apply the test correctly, and provides practical insights to avoid common mistakes.
What Is a Function?
In mathematics, a function is a relationship between two sets where each input (from the domain) corresponds to exactly one output (in the range). Think of it as a machine: you put in a number, and the machine gives you back one—and only one—result. For example, the equation \\( f(x) = x^2 \\) is a function because every value of \\( x \\) produces a single, unique result.
Graphically, this means that for any vertical position on the x-axis, there should be at most one point on the graph directly above or below it. If a single x-value leads to multiple y-values, the relationship fails the definition of a function.
The Vertical Line Test Explained
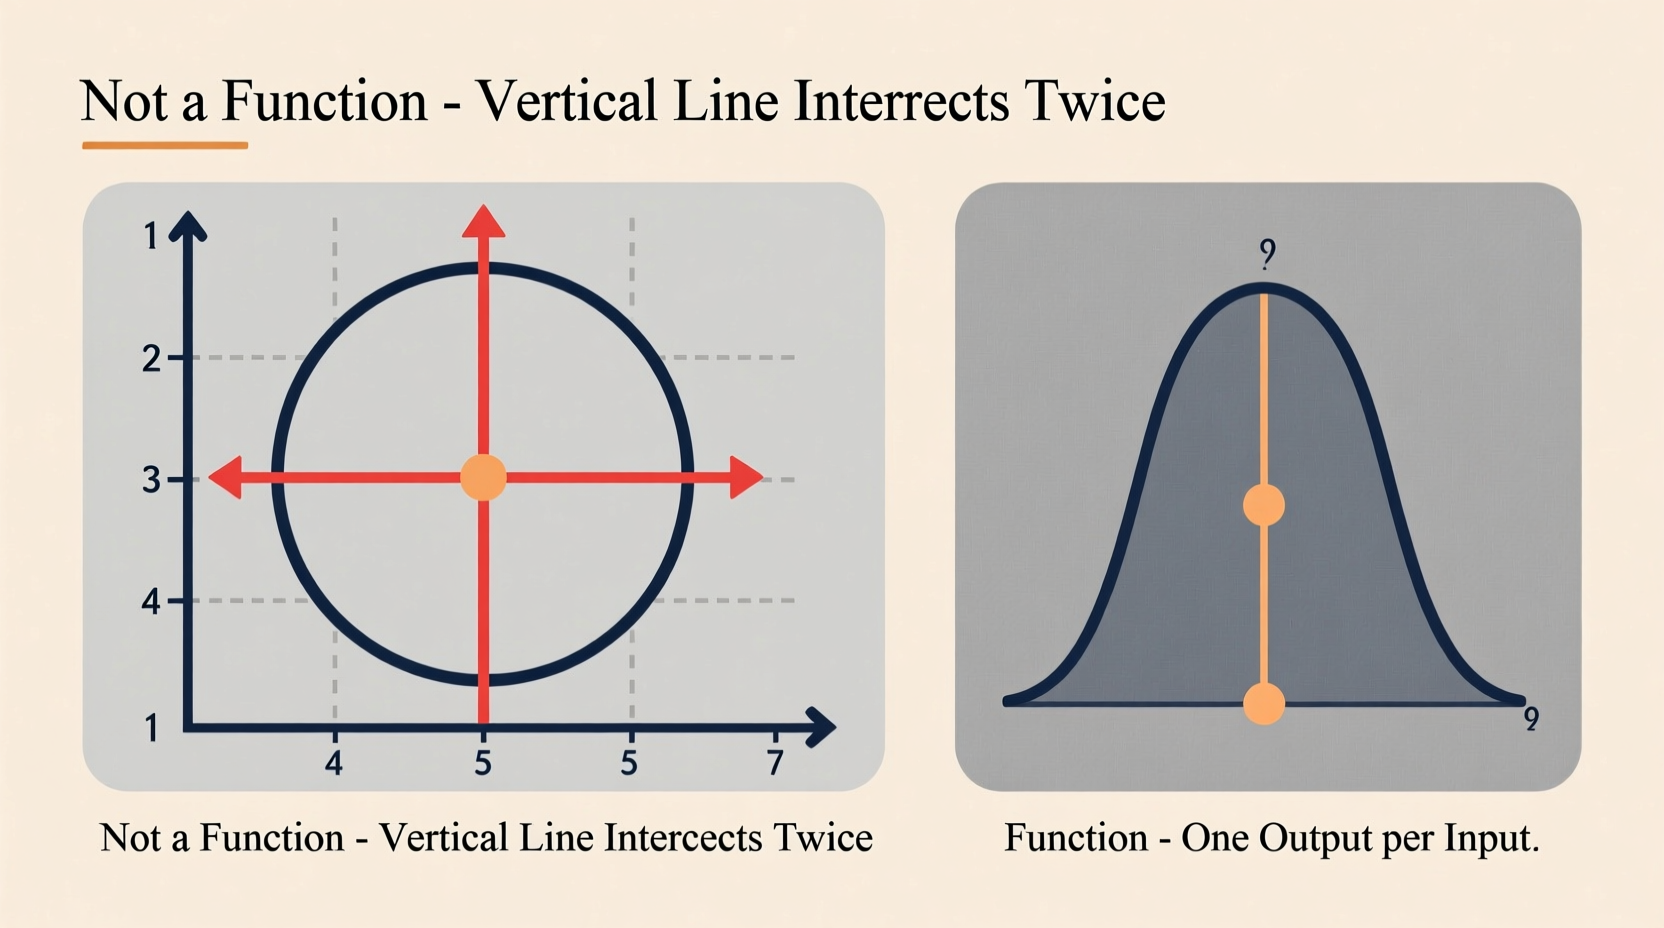
The vertical line test is a visual method used to determine whether a curve on a coordinate plane represents a function. Here’s how it works:
- Imagine drawing vertical lines across the graph from left to right.
- If any vertical line intersects the graph at more than one point, the graph does not represent a function.
- If every vertical line touches the graph at no more than one point, then it does represent a function.
This test works because a vertical line corresponds to a constant x-value. If that line crosses the graph more than once, it means that one input (x) is associated with multiple outputs (y), violating the definition of a function.
Common Graphs That Pass the Test
- Straight lines (except vertical ones)
- Parabolas that open upward or downward
- Cubic curves like \\( y = x^3 \\)
- Exponential growth and decay curves
Common Graphs That Fail the Test
- Circles (e.g., \\( x^2 + y^2 = r^2 \\))
- Ellipses
- Horizontal parabolas (e.g., \\( x = y^2 \\))
- Figure-eight shapes
Step-by-Step Guide to Applying the Vertical Line Test
Follow this structured approach to confidently analyze any graph:
- Sketch or examine the graph carefully. Ensure all key features—peaks, valleys, intersections—are visible.
- Select strategic positions along the x-axis: near turning points, symmetry axes, and areas where overlapping might occur.
- Visualize or draw thin vertical lines at these locations. Use a ruler if working on paper.
- Check intersection points. Count how many times each line crosses the curve.
- Evaluate the result: If even one line crosses twice or more, the graph is not a function.
- Double-check edge cases, such as isolated points or discontinuities, which may appear ambiguous.
“Students often confuse symmetry with functionality. A graph can be symmetric and still fail the vertical line test—like a circle. Always test, don’t assume.” — Dr. Linda Reyes, Mathematics Educator
Real Example: Analyzing a Circle
Consider the equation \\( x^2 + y^2 = 9 \\), which describes a circle centered at the origin with radius 3. Although symmetrical and smooth, this graph does not represent a function.
Take the vertical line at \\( x = 0 \\)—the y-axis. It intersects the circle at two points: \\( (0, 3) \\) and \\( (0, -3) \\). Since a single x-value maps to two different y-values, the relationship violates the function rule. Therefore, despite being a well-defined relation, it fails the vertical line test.
This example illustrates why equations involving both \\( x^2 \\) and \\( y^2 \\) typically do not define functions unless solved explicitly for y with restricted domains.
Do’s and Don’ts When Using the Vertical Line Test
| Do’s | Don’ts |
|---|---|
| Use the test on continuous and discrete graphs alike | Assume symmetry implies functionality |
| Apply it to piecewise and implicit curves | Ignore gaps or asymptotes when analyzing intersections |
| Test multiple lines, especially near complex regions | Conclude too quickly after checking only one line |
| Combine with algebraic verification when possible | Mistake a function’s inverse for a function without testing |
Tips for Avoiding Common Misconceptions
Many learners struggle with subtle misunderstandings about what constitutes a function. These tips clarify frequent pitfalls:
- Vertical lines are not functions. A line like \\( x = 5 \\) fails the test because every point on it shares the same x but has infinitely many y-values.
- Functions don't need to be continuous. A set of scattered points can still be a function—if no two share the same x-coordinate.
- One-to-one vs. function: All one-to-one functions pass the vertical line test, but not all functions are one-to-one. The vertical line test checks functionality; the horizontal line test checks invertibility.
Frequently Asked Questions
Can a graph be a function if it has a sharp corner or cusp?
Yes. Continuity or smoothness isn’t required for a function. As long as each x-value corresponds to only one y-value, the graph passes the vertical line test—even if it includes corners, jumps, or cusps. For example, the absolute value function \\( y = |x| \\) has a sharp vertex at the origin but is still a valid function.
Does the vertical line test work for non-continuous graphs?
Absolutely. Whether the graph consists of connected curves, separate segments, or individual plotted points, the rule remains the same: check whether any vertical line crosses more than one point. Discontinuities—like holes or jumps—don’t invalidate a function as long as the single-output rule holds.
What if the graph only fails the test at a single point?
Even one violation is enough. If there exists just one x-value that produces two or more y-values, the entire relation fails to qualify as a function. Precision matters: mathematical definitions require consistency across the entire domain.
Conclusion: Mastering the Basics Builds Stronger Math Skills
The vertical line test is more than a classroom exercise—it’s a critical thinking tool that sharpens your ability to interpret relationships visually. By mastering this technique, you lay the groundwork for deeper topics like function transformations, inverses, and calculus concepts such as limits and continuity.
Whether you're preparing for exams, tutoring others, or simply strengthening your analytical skills, applying the vertical line test with confidence makes a tangible difference. Practice regularly with diverse graphs, question assumptions, and combine visual analysis with algebraic reasoning.


 浙公网安备
33010002000092号
浙公网安备
33010002000092号 浙B2-20120091-4
Comments
No comments yet. Why don't you start the discussion?