
Every website you visit is built on layers of code that dictate its structure, design, and functionality. Understanding how to view and interpret this underlying code opens doors to better troubleshooting, learning web development, improving SEO, or even auditing site security. The good news? You don’t need to be a programmer to get started. Whether you're a complete beginner or someone brushing up on skills, accessing and analyzing a webpage’s source code is easier than you think.
Why Analyzing Source Code Matters
Behind every button click, image display, or form submission lies HTML, CSS, JavaScript, and sometimes backend logic delivered through APIs. By examining the source code, you gain insight into:
- How content is structured using HTML tags
- What styles control layout and visuals via CSS
- Which scripts enable interactivity with JavaScript
- How metadata influences search engine visibility
- Potential performance bottlenecks or accessibility issues
This knowledge benefits marketers evaluating SEO practices, developers debugging layouts, students learning front-end coding, and curious users wanting to understand how websites work under the hood.
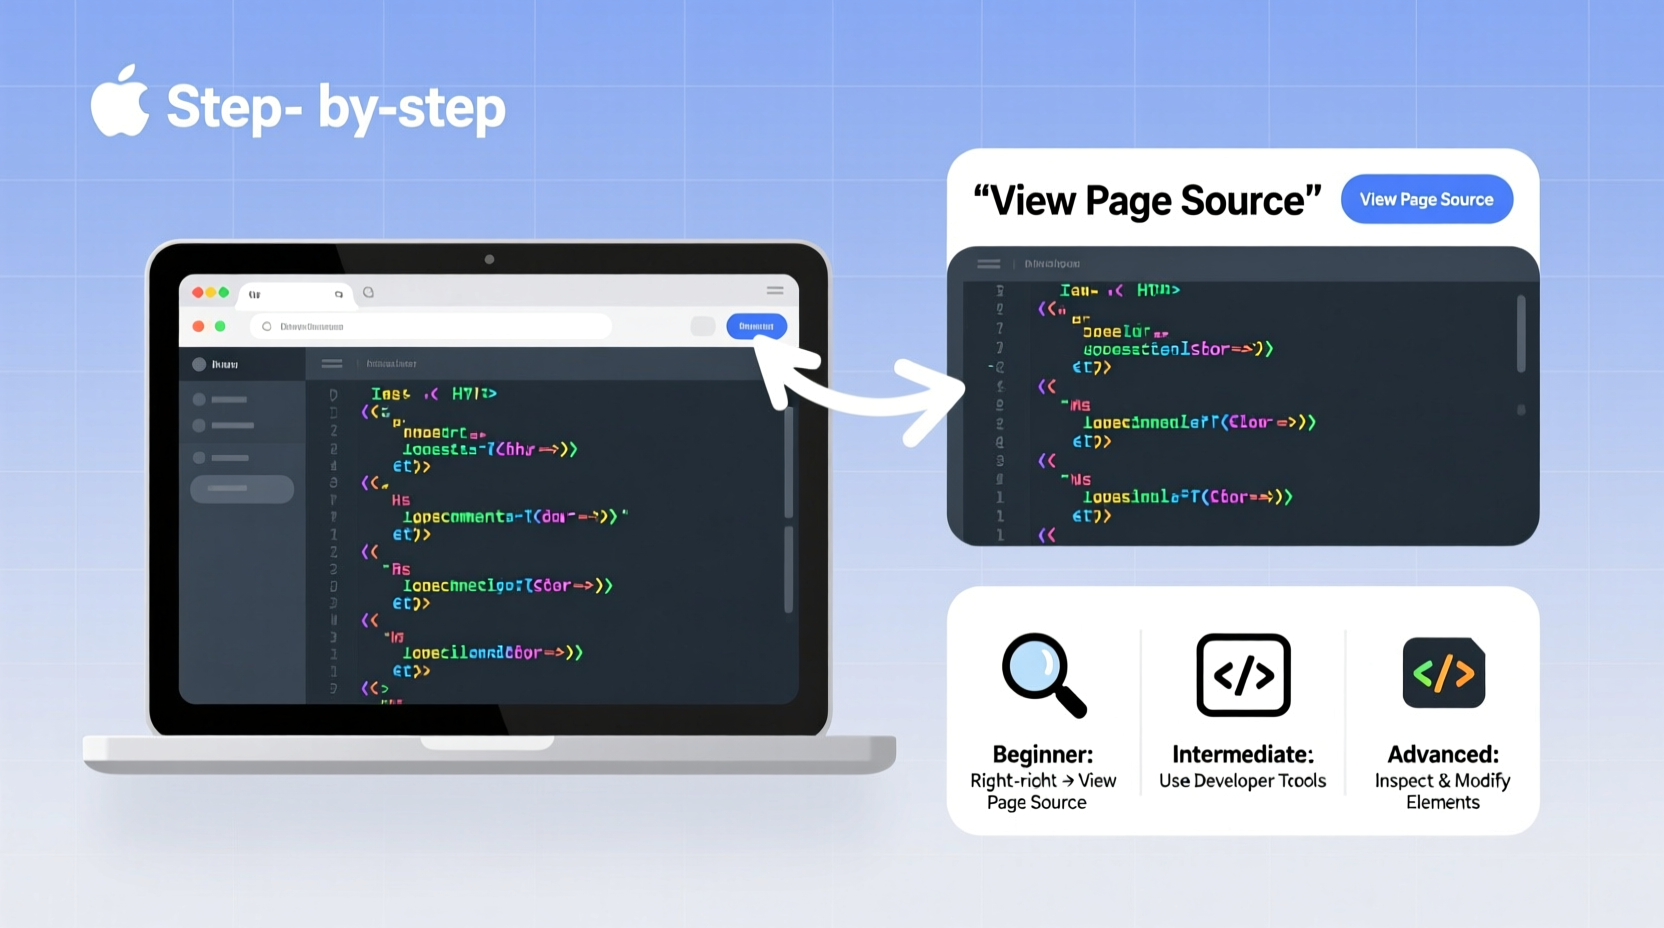
Step-by-Step Guide to Accessing Source Code
No special software is required to view basic source code. All major browsers include built-in developer tools. Follow these steps regardless of your experience level.
- Open Your Browser: Use Chrome, Firefox, Safari, Edge, or Brave.
- Navigate to Any Webpage: Go to a site like google.com or wikipedia.org.
- Right-Click and Select “Inspect”: This opens Developer Tools, showing the live HTML structure.
- Alternatively, Use Keyboard Shortcuts:
- Windows/Linux: Ctrl + U (view page source), F12 or Ctrl + Shift + I (developer tools)
- Mac: Cmd + Option + U (source), Cmd + Option + I (dev tools)
- Explore the Elements Panel: In DevTools, the \"Elements\" tab displays real-time HTML as it renders in the browser—even after JavaScript modifies it.
The difference between “View Page Source” and “Inspect Element” is critical. The former shows the raw HTML sent by the server. The latter reflects the current Document Object Model (DOM), including dynamic changes made by scripts.
Real Example: Diagnosing a Missing Header
A small business owner noticed their homepage headline wasn’t appearing. Using “Inspect,” they found the H1 tag was present but hidden due to a CSS rule: display: none;. A quick edit in DevTools confirmed the fix—removing that line restored visibility. They then contacted their developer with precise details, saving hours of guesswork.
Beginner-Friendly Analysis Techniques
If you’re new to code, start with simple observations. Focus on readable patterns rather than syntax mastery.
- Look for semantic tags like
<header>,<nav>,<main>, and<footer>—they reveal page organization. - Find
<title>and<meta name=\"description\">inside the<head>section to see SEO-critical elements. - Search for keywords using Ctrl + F within DevTools to locate specific text or links.
“Understanding source code isn’t about memorizing languages—it’s about recognizing patterns that shape user experience.” — Lena Patel, Front-End Architect at WebFlow Labs
Intermediate Tips: Leveraging Browser Developer Tools
Once comfortable navigating the DOM, dive deeper using advanced panels in Developer Tools:
| Tool Tab | Use Case | Pro Tip |
|---|---|---|
| Console | Run JavaScript commands or view errors | Type document.title to instantly read the page title |
| Network | Analyze loading speed and resource requests | Filter by JS/CSS/Images to spot large files slowing down load time |
| Elements | Edit HTML/CSS live (changes aren’t saved) | Toggle classes or delete elements to preview redesigns |
| Sources | View loaded scripts and set breakpoints | Use for debugging custom JavaScript behavior |
| Lighthouse | Generate performance, accessibility, SEO audits | Run mobile simulation to test responsive design flaws |
Advanced Methods: Extracting and Saving Code
For offline analysis or deeper inspection, extract full source code beyond what DevTools show dynamically.
- Save Entire Page: Right-click on the page > Save As > Choose “Webpage, Complete” to download HTML and assets locally.
- Use cURL or wget: Command-line tools useful for automation:
curl https://example.com -o page.html
- Browser Automation Scripts: With Puppeteer (Node.js) or Selenium (Python), programmatically fetch rendered source after JavaScript execution.
When analyzing third-party sites, respect legal boundaries. Avoid aggressive scraping unless permitted by terms of service or robots.txt.
Checklist: Effective Source Code Analysis Routine
- ✅ Open DevTools using F12 or right-click → Inspect
- ✅ Examine the
<head>for title, meta description, and canonical tags - ✅ Search for key content using Ctrl+F in Elements panel
- ✅ Check Network tab for slow-loading resources
- ✅ Run Lighthouse audit for optimization suggestions
- ✅ Test responsiveness using Device Toggle (phone/tablet icon)
- ✅ Validate HTML using W3C checker (validator.w3.org)
Frequently Asked Questions
Can viewing source code harm a website?
No. Viewing source code is passive and safe. It's akin to reading a public document. However, modifying it live in DevTools only affects your local view—not the actual site.
Why does the source code look different from what I see when inspecting?
The original source (via Ctrl+U) doesn’t reflect JavaScript modifications. The DOM in DevTools does. For modern single-page apps (like React), most content is injected dynamically—so “View Source” may appear sparse.
Is it legal to analyze any website’s source code?
Yes, viewing publicly available source code is legal and encouraged for education and compatibility. However, republishing, reverse-engineering proprietary logic, or automated scraping may violate copyright or terms of use.
Mastering the Basics Builds Confidence
You don’t need a computer science degree to explore how websites are built. Start small: inspect your favorite blog, find the main heading, change its color temporarily in DevTools, and watch the magic happen. Each step builds intuition. Over time, you’ll recognize common frameworks, detect poor SEO practices, or identify accessibility red flags at a glance.
Whether you're optimizing your own site, learning to code, or just satisfying curiosity, the ability to access and analyze source code empowers informed decisions. The tools are free, universal, and waiting in your browser right now.


 浙公网安备
33010002000092号
浙公网安备
33010002000092号 浙B2-20120091-4
Comments
No comments yet. Why don't you start the discussion?