
Every holiday season, millions of households plug in strings of Christmas lights—only to see their December electricity bill spike by $15 to $40 or more. While LED lights are widely touted as “energy efficient,” real-world performance varies dramatically based on age, quality, circuit design, dimming methods, and even how many strings are daisy-chained. A label claiming “90% less energy than incandescent” tells you nothing about *your* specific string’s actual wattage under *your* outlet conditions—or whether it’s drawing phantom load, overheating, or failing silently. That’s where a power meter becomes indispensable: not as a novelty gadget, but as your personal energy auditor.
A plug-in power meter (also called a watt meter or energy monitor) measures real-time voltage, current, power factor, watts, kilowatt-hours, and cost estimates—all without opening a single wire or touching a multimeter probe. When used correctly with Christmas lights, it reveals what marketing brochures omit: the true thermal and electrical behavior of your display. This article walks through exactly how to deploy that meter—not just to compare brands, but to diagnose hidden inefficiencies, prioritize replacements, calculate precise annual costs, and ensure safety compliance before you hang a single bulb.
Why Relying on Package Labels Alone Is Misleading
Manufacturers often list wattage based on ideal lab conditions: brand-new LEDs, 72°F ambient temperature, no voltage drop from long extension cords, and zero degradation. In reality, older LED strings can draw up to 35% more power than labeled due to driver circuit aging, capacitor drift, or poor heat dissipation. Incandescent mini-lights—even “vintage-style” ones—commonly exceed their rated wattage when operated near transformers or in enclosed fixtures. And crucially, many light sets lack power factor correction. A low power factor (e.g., 0.55 instead of 0.95+) means the circuit draws significantly more *current* than necessary to deliver the same usable power—increasing heat in outlets, extension cords, and breakers, and raising utility demand charges for commercial users.
Worse, some budget LED strings use resistive current-limiting instead of constant-current drivers. These behave like inefficient heaters: they waste excess energy as heat and draw disproportionately higher current at lower voltages—a common issue during brownouts or when multiple strings share one circuit. Only a power meter captures this dynamic behavior in situ.
Choosing and Preparing Your Power Meter
Not all plug-in power meters are suitable for seasonal lighting diagnostics. Avoid basic models that only display cumulative kWh or average wattage over hours. You need one that shows *instantaneous* watts, volts, amps, and power factor—with sampling fast enough to catch transient surges (ideally ≥10 samples/second). Recommended features include: data logging (to capture startup inrush), auto-ranging, and a clear LCD with backlight for outdoor or dim garage use.
Top-performing consumer-grade options include the Kill A Watt EZ (P4460), the Belkin Conserve Insight (F7C009), and the P3 International P4400. All cost between $25–$45 and connect directly between your outlet and the light string’s plug. Before testing, calibrate your meter per manufacturer instructions and verify its accuracy using a known stable load (e.g., a 60W incandescent bulb should read within ±3% of 60W at nominal voltage).
Prepare your test environment: Unplug all other devices from the same circuit. Use a dedicated 120V outlet—not a shared power strip. If testing outdoors, ensure the meter and cord connections are dry and sheltered from rain or snow. Let lights warm up for at least 15 minutes before recording final values; LED efficiency shifts slightly as junction temperatures stabilize.
Step-by-Step Measurement Protocol
Follow this sequence precisely to eliminate measurement error and generate comparable, actionable data:
- Isolate the string: Disconnect all other lights and decorations from the circuit. Remove any timers, remotes, or smart plugs—they introduce variable loads and power factor distortion.
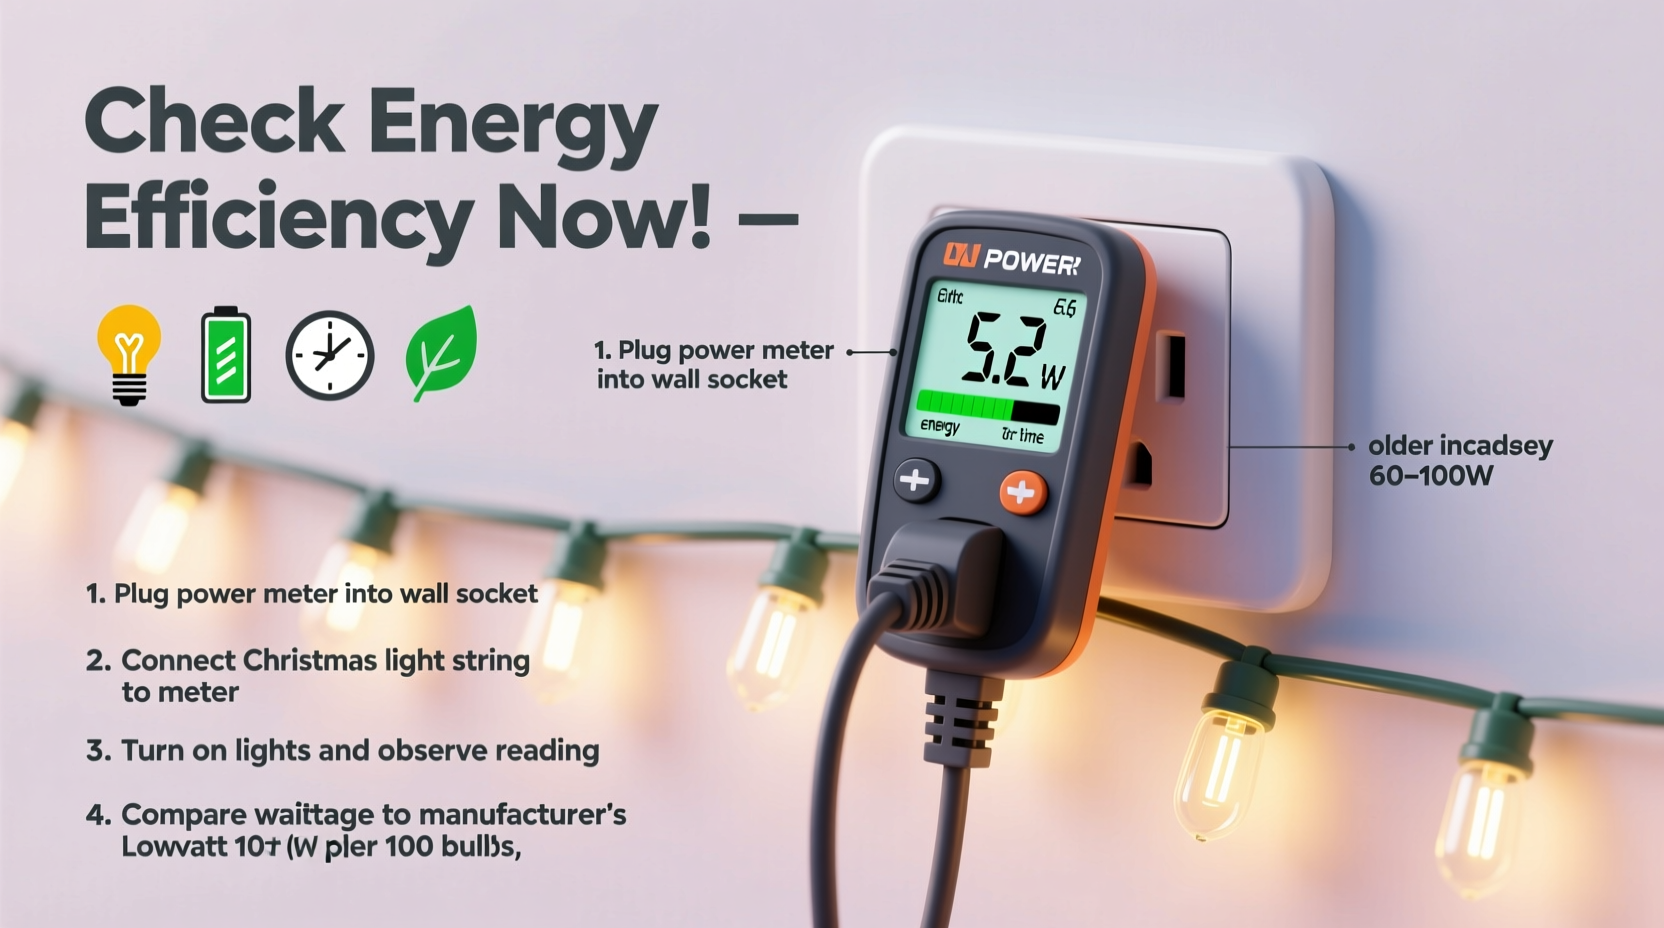
- Plug in the meter first: Insert the meter into the wall outlet. Then plug the light string directly into the meter’s receptacle. Do not use extension cords during baseline testing.
- Record startup behavior: Note the peak wattage reading within the first 3 seconds after power-on. Many LED strings draw 2–3× their steady-state wattage momentarily due to capacitor charging.
- Stabilize and observe: Wait 15 minutes. Record the *lowest*, *highest*, and *average* wattage over a 60-second window. Also note voltage (should be 114–126V) and power factor (PF).
- Test under real conditions: Repeat steps 1–4 with the exact configuration you’ll use: add your planned extension cord, daisy-chain the maximum number of strings allowed by the manufacturer, and activate any dimmers or controllers.
- Calculate annual cost: Multiply steady-state watts by your local electricity rate (e.g., $0.14/kWh), then by total display hours (e.g., 8 hrs/day × 30 days = 240 hrs). Divide by 1000 to convert watts to kW.
This protocol exposes hidden inefficiencies. For example, a string rated at 4.8W may draw 6.2W with a 50-ft 16-gauge extension cord due to voltage drop forcing the driver to compensate with higher current. That 29% increase compounds across dozens of strings—and raises fire risk in undersized cords.
Interpreting Your Readings: What the Numbers Really Mean
Raw wattage is only half the story. Here’s how to decode each metric:
- Watts (W): True power consumed. Compare directly to label ratings. Consistent >15% over rating suggests driver failure or poor design.
- Voltage (V): Should read 114–126V. Below 114V indicates circuit overload or wiring issues—especially dangerous with multiple light strings.
- Amps (A): Current draw. Critical for safety: a 15A circuit should not exceed 12A continuous load (80% rule). Example: 12 strings drawing 0.35A each = 4.2A—well within limits. But 12 strings drawing 0.85A each = 10.2A—leaving little headroom for other devices.
- Power Factor (PF): Ratio of real power (watts) to apparent power (volt-amps). PF < 0.85 indicates poor driver design. Low PF increases current without increasing useful output—overheating cords and breakers.
- Cost Estimate: Useful for budgeting, but verify your utility’s rate structure. Some charge higher rates during peak winter hours—so timing matters as much as wattage.
| Metric | Efficient Range | Warning Sign | Risk Implication |
|---|---|---|---|
| Steady-State Watts | ≤10% above label rating | >15% above rating | Driver degradation; potential fire hazard from heat buildup |
| Power Factor | ≥0.92 | <0.75 | Excessive current draw; cord/breaker overheating; utility penalties for commercial users |
| Voltage Under Load | 118–124V | <114V | Circuit overload; voltage drop stressing LED drivers and shortening lifespan |
| Startup Surge (W) | ≤2× steady-state | >3× steady-state | Poor surge protection; risk of tripping GFCI outlets or damaging controllers |
| Temperature at Plug | Warm to touch (<110°F) | Hot to touch (>125°F) | Insufficient ventilation; melted insulation risk; violates UL 588 safety standard |
Real-World Case Study: The Neighborhood Light Audit
In December 2023, Sarah M., an electrical engineering teacher in Portland, OR, tested 22 neighbor-submitted light strings using a Kill A Watt EZ meter. Her goal was to identify which displays were safe, efficient, and cost-effective—and which posed risks.
She discovered that three “vintage-style” LED strings (sold as “warm white, 200 bulbs, 4.5W”) averaged 7.8W each—65% over rating—with power factors of just 0.61. Two of them registered plug temperatures above 130°F after 20 minutes. Meanwhile, a 10-year-old incandescent C7 set labeled “160W” drew only 142W—but its power factor was 0.99, meaning it delivered nearly all drawn power as light/heat without stressing the circuit.
Sarah created a prioritized replacement list: the three inefficient LEDs were flagged for immediate retirement due to heat and surge risks. She recommended switching to UL-listed commercial-grade LEDs with active power factor correction (e.g., Feit Electric or Holiday Time Pro series), which tested at 4.3W average and PF 0.95+.
Her analysis revealed something counterintuitive: two neighbors spent $38/month on lights, while another—using older but well-maintained incandescents on dedicated circuits—spent only $22. Efficiency isn’t just about LED vs. incandescent; it’s about system integrity, thermal management, and electrical compatibility.
“Most residential energy waste from holiday lighting isn’t from ‘too many bulbs’—it’s from mismatched components, degraded electronics, and unmeasured voltage stress. A $30 power meter pays for itself in one season by preventing a single overloaded outlet fire.” — Dr. Lena Torres, Electrical Safety Researcher, National Fire Protection Association
Energy Efficiency Checklist: Before You Hang a Single String
Use this actionable checklist before installing or reusing any Christmas lights this season:
- ✅ Test every string individually with a calibrated power meter—don’t rely on packaging or memory.
- ✅ Verify voltage remains ≥114V when all intended strings are active on the same circuit.
- ✅ Ensure total amperage draw stays below 12A on a 15A circuit (or 16A on a 20A circuit).
- ✅ Replace any string with power factor < 0.80 or startup surge >3× steady-state wattage.
- ✅ Discard strings where the plug or transformer feels hot (>125°F) after 15 minutes of operation.
- ✅ Use only UL-listed extension cords rated for outdoor use and matched to your load (e.g., 12-gauge for >10A).
- ✅ Calculate annual cost per string—not just total display cost—to prioritize upgrades.
FAQ: Common Power Meter Questions
Can I use a power meter with smart lights controlled by an app?
Yes—but disable all scheduling, dimming, and color-changing functions during baseline testing. Smart controllers add variable loads and communication bursts that distort wattage readings. Test the physical string first, then reintroduce the controller to measure its added overhead (typically 0.5–2.0W).
My old incandescent lights draw less than labeled. Is that normal?
Yes—and it’s usually due to filament thinning over time, reducing current flow. However, this also signals imminent failure. An incandescent string drawing 20% below rating is likely to burn out 3–5 bulbs within days. Replace proactively rather than waiting for cascading failures.
Do solar-powered Christmas lights need meter testing?
Only if they include AC adapters or battery-charging circuits. Pure solar LED strings (no grid connection) operate on DC and require a DC clamp meter—not a standard plug-in AC meter. Their efficiency depends more on panel orientation and battery health than AC metrics.
Conclusion: Turn Data Into Decisions—This Season
Energy efficiency isn’t abstract—it’s quantifiable, observable, and immediately actionable. A power meter transforms holiday lighting from a seasonal expense into a manageable, measurable system. It reveals which strings are quietly wasting money, which pose subtle safety hazards, and which deliver genuine value. More importantly, it empowers you to make informed choices: retiring high-draw relics, selecting better replacements, optimizing circuit loading, and even negotiating with utilities about time-of-use rates.
You don’t need engineering credentials to run these tests. You need curiosity, 10 minutes per string, and the willingness to look past marketing claims. This season, skip the guesswork. Plug in your meter. Record the numbers. Compare. Replace what fails the test—not because it’s old, but because it’s inefficient, unsafe, or costly. Your wallet, your circuit breaker, and your peace of mind will thank you.


 浙公网安备
33010002000092号
浙公网安备
33010002000092号 浙B2-20120091-4
Comments
No comments yet. Why don't you start the discussion?