
Understanding variation in data is essential across fields—from finance and science to education and quality control. One of the most powerful tools for measuring this variation is standard deviation. Specifically, calculating one standard deviation gives you a precise window into how spread out your data points are from the average. When used correctly, it transforms raw numbers into meaningful insights. This guide walks you through every stage of computing one standard deviation—accurately and confidently—so you can interpret your data with clarity.
What Is Standard Deviation and Why It Matters
Standard deviation quantifies the amount of variation or dispersion within a dataset. A low standard deviation means values tend to be close to the mean (average), while a high standard deviation indicates that values are spread out over a wider range.
In practical terms, knowing one standard deviation allows you to answer questions like:
- How consistent are test scores in a classroom?
- How volatile is a stock’s daily return?
- Are manufacturing measurements within acceptable tolerances?
The power lies not just in the number itself but in what it reveals about reliability, risk, and predictability. As statistician W. Edwards Deming once said:
“Without data, you’re just another person with an opinion.” — W. Edwards Deming
Step-by-Step Guide to Calculating One Standard Deviation
Follow these six structured steps to compute one standard deviation manually. We’ll use a real-world example throughout: monthly sales figures (in thousands) for a small business over six months: [45, 50, 55, 60, 53, 47].
Step 1: Collect and List Your Data Points
Begin with a complete set of numerical observations. Ensure they are accurate and relevant to your analysis.
Data: 45, 50, 55, 60, 53, 47
Step 2: Calculate the Mean (Average)
Add all values and divide by the number of data points.
Sum = 45 + 50 + 55 + 60 + 53 + 47 = 310
Number of data points (n) = 6
Mean (μ) = 310 ÷ 6 ≈ 51.67
Step 3: Find the Difference Between Each Value and the Mean
Subtract the mean from each individual value to find deviations.
- 45 – 51.67 = -6.67
- 50 – 51.67 = -1.67
- 55 – 51.67 = 3.33
- 60 – 51.67 = 8.33
- 53 – 51.67 = 1.33
- 47 – 51.67 = -4.67
Step 4: Square Each Deviation
Squaring eliminates negative signs and emphasizes larger differences.
- (-6.67)² ≈ 44.49
- (-1.67)² ≈ 2.79
- (3.33)² ≈ 11.09
- (8.33)² ≈ 69.39
- (1.33)² ≈ 1.77
- (-4.67)² ≈ 21.81
Step 5: Compute the Variance
For a population: divide the sum of squared deviations by n.
For a sample: divide by n–1 (this corrects bias in estimation).
Sum of squared deviations ≈ 44.49 + 2.79 + 11.09 + 69.39 + 1.77 + 21.81 = 151.34
If treating as a population:
Variance (σ²) = 151.34 ÷ 6 ≈ 25.22
If treating as a sample:
Sample variance (s²) = 151.34 ÷ 5 ≈ 30.27
Step 6: Take the Square Root to Get Standard Deviation
This returns the measure to the original unit of measurement.
Population standard deviation (σ): √25.22 ≈ 5.02
Sample standard deviation (s): √30.27 ≈ 5.50
So, one standard deviation is approximately 5.02 (population) or 5.50 (sample). This tells us that most data points lie within about 5 units above or below the mean of 51.67.
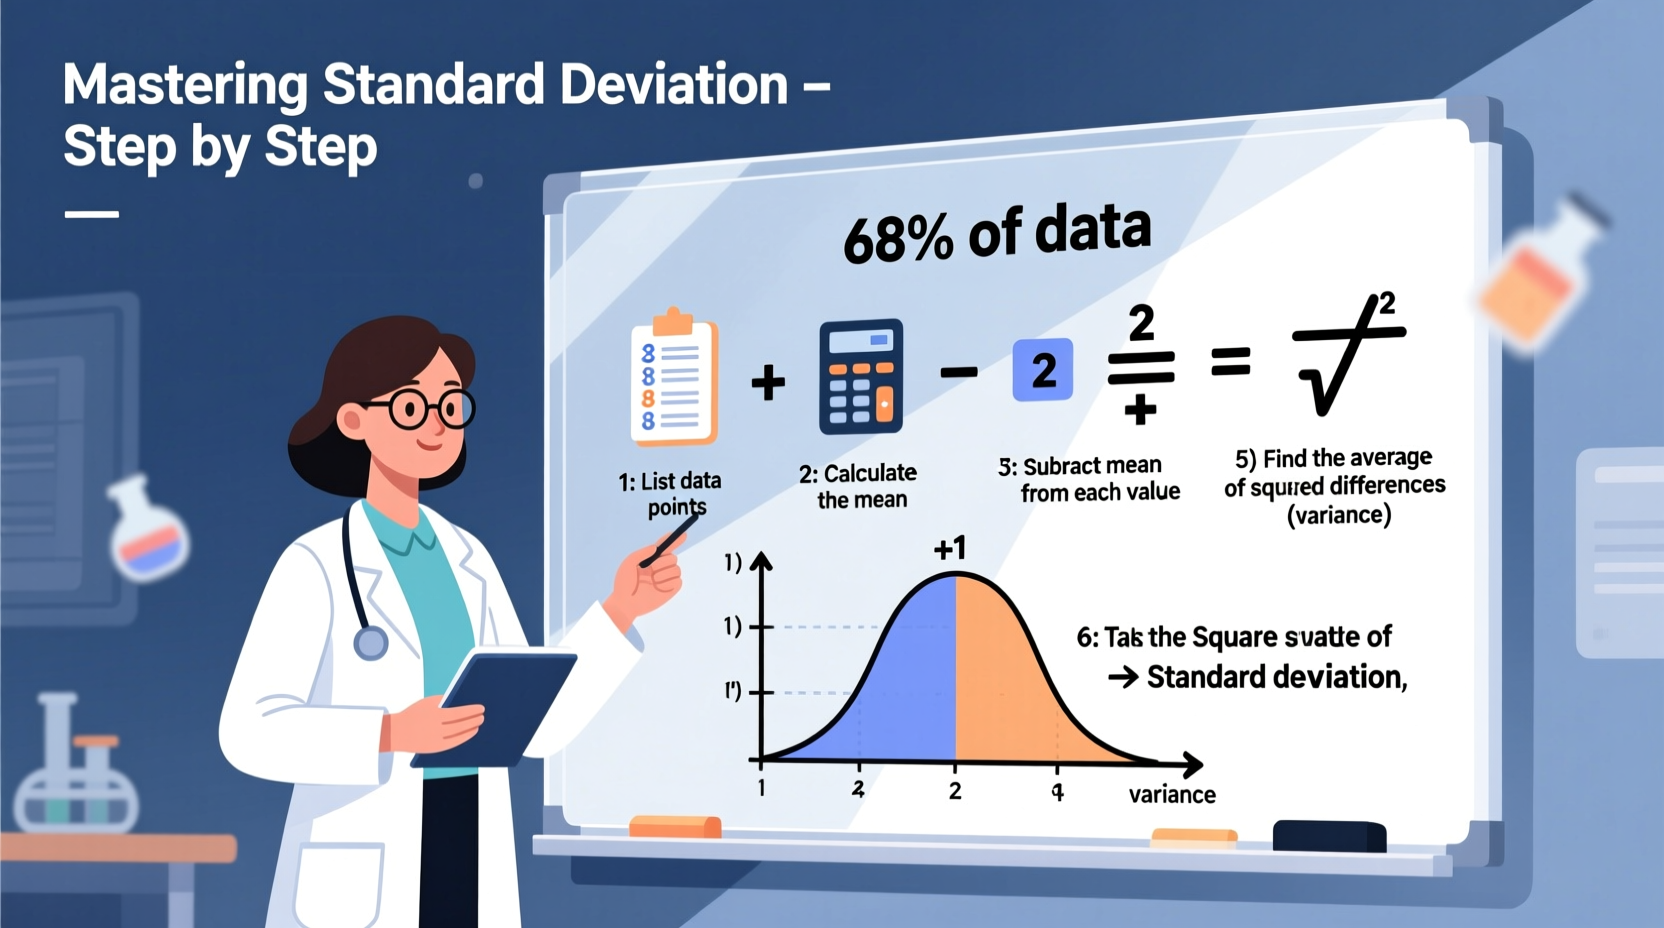
Interpreting One Standard Deviation: The 68% Rule
In normally distributed data, one standard deviation from the mean captures about 68% of all observations. Using our example:
Mean = 51.67
One standard deviation (population) ≈ ±5.02
Range: 51.67 – 5.02 = 46.65 to 51.67 + 5.02 = 56.69
Therefore, roughly two-thirds of the monthly sales fall between $46,650 and $56,690. This insight helps assess performance consistency and forecast future outcomes with realistic bounds.
Common Pitfalls and Best Practices
Mistakes in calculating or interpreting standard deviation can lead to flawed decisions. Below is a checklist to ensure accuracy.
✅ Calculation Checklist
- Verify all data entries for accuracy
- Determine if the dataset represents a population or sample
- Double-check arithmetic, especially squaring and square roots
- Use technology (like Excel or calculators) to verify manual calculations
- Report both the mean and standard deviation together for context
🚫 Common Mistakes to Avoid
| Mistake | Why It's Wrong | How to Fix |
|---|---|---|
| Using n instead of n–1 for samples | Underestimates variability; biased result | Apply Bessel’s correction: divide by n–1 |
| Ignoring outliers without investigation | Skews standard deviation significantly | Analyze outliers first—remove only if justified |
| Applying 68% rule to non-normal distributions | Rule doesn’t hold for skewed or multimodal data | Check distribution shape before interpreting |
Real Example: Quality Control in Manufacturing
A factory produces metal rods designed to be 100 cm long. Engineers take a random sample of six rods and measure their lengths: [99.5, 100.2, 100.0, 99.8, 100.5, 99.6]. They want to know how consistent production is.
Step-by-step calculation:
- Mean = (99.5 + 100.2 + 100.0 + 99.8 + 100.5 + 99.6) / 6 = 599.6 / 6 ≈ 99.93 cm
- Deviations: -0.43, 0.27, 0.07, -0.13, 0.57, -0.33
- Squared deviations: 0.185, 0.073, 0.005, 0.017, 0.325, 0.109
- Sum of squares ≈ 0.714
- Sample variance = 0.714 / 5 ≈ 0.143
- Sample standard deviation = √0.143 ≈ 0.378 cm
Result: One standard deviation is ~0.38 cm. So, about 68% of rods vary between 99.55 cm and 100.31 cm—well within tolerance. Process is stable.
“In precision engineering, even fractions of a millimeter matter. Standard deviation turns subjective 'feel' into objective control.” — Dr. Lena Torres, Industrial Statistician
Frequently Asked Questions
Can standard deviation ever be negative?
No. Since it involves squaring differences and taking a square root, standard deviation is always zero or positive. A value of zero means all data points are identical.
Is a smaller standard deviation always better?
It depends on context. In manufacturing or medicine, low variation is desirable for consistency. But in investment portfolios, moderate volatility may indicate growth potential. Interpretation should align with goals.
How does standard deviation differ from mean absolute deviation?
Both measure spread, but standard deviation squares deviations, giving more weight to extreme values. This makes it more sensitive to outliers—but also mathematically convenient for advanced statistics like regression and hypothesis testing.
Final Thoughts: Turn Numbers Into Insight
Calculating one standard deviation isn’t just a mathematical exercise—it’s a gateway to deeper understanding. Whether you're analyzing exam results, tracking fitness progress, or optimizing business operations, this metric reveals patterns invisible to averages alone. By following the steps outlined here, avoiding common errors, and interpreting results wisely, you gain a sharper lens on your data.
Don’t stop at calculation. Ask: What does this variation tell me? Are changes due to randomness or a real underlying shift? Use standard deviation not just to describe, but to decide.


 浙公网安备
33010002000092号
浙公网安备
33010002000092号 浙B2-20120091-4
Comments
No comments yet. Why don't you start the discussion?