
Effective inventory management is the backbone of any successful retail, manufacturing, or distribution business. One of the most essential metrics in this process is average inventory — a figure that helps businesses understand stock levels over time, forecast demand, and optimize ordering cycles. Misjudging inventory can lead to overstocking, increased holding costs, or worse—stockouts that damage customer trust. This guide breaks down exactly how to calculate average inventory accurately, why it matters, and how to use it to make smarter operational decisions.
Why Average Inventory Matters
Average inventory provides a more stable view of stock levels than relying on a single point-in-time count. Businesses experience fluctuations due to seasonal demand, supplier delays, or sales spikes. Using a snapshot of inventory on one day may misrepresent actual usage patterns.
By calculating the average inventory over a defined period—such as a month, quarter, or year—managers gain insights into:
- Inventory turnover rate
- Carrying cost efficiency
- Demand forecasting accuracy
- Supplier performance and reorder timing
- Cash flow implications of stock holdings
“Average inventory isn’t just a number—it’s a diagnostic tool for understanding how efficiently your supply chain operates.” — Dr. Lena Patel, Supply Chain Analytics Professor, MIT
The Basic Formula for Average Inventory
The most commonly used formula for calculating average inventory is simple but powerful:
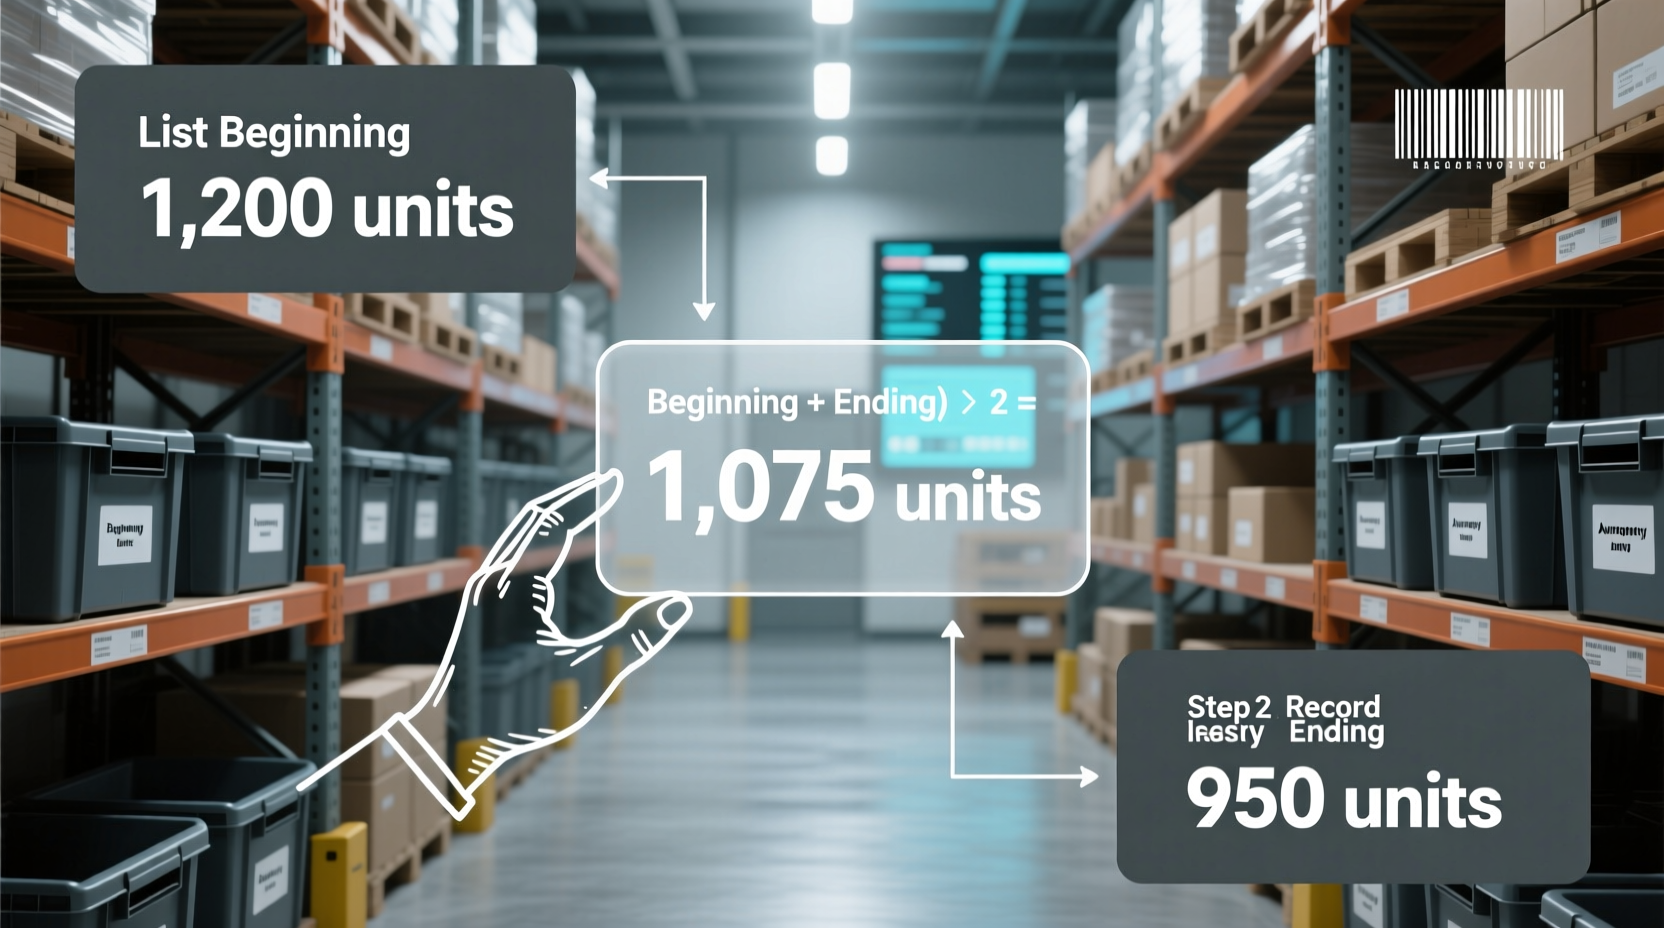
Average Inventory = (Beginning Inventory + Ending Inventory) ÷ 2
This formula assumes a relatively linear change in inventory levels between two points. It works best when inventory fluctuates gradually rather than erratically.
Step-by-Step Calculation Example
- Determine the time period: Choose a consistent interval—monthly, quarterly, or annually.
- Find beginning inventory value: This is the total dollar value (or unit count) of inventory at the start of the period.
- Find ending inventory value: The total value at the end of the same period.
- Add both values and divide by two.
Example:
A retail store starts January with $45,000 worth of goods and ends the month with $55,000.
Average Inventory = ($45,000 + $55,000) ÷ 2 = $50,000
Advanced Methods for Greater Accuracy
While the basic formula suffices for many small to mid-sized businesses, companies with high volatility or complex supply chains may benefit from more refined approaches.
Weighted Average Over Multiple Periods
When inventory swings dramatically month-to-month, a simple average may not reflect reality. A better approach is to take inventory readings at regular intervals and compute a weighted mean.
Formula:
Average Inventory = (Sum of Inventory Values at Each Interval) ÷ (Number of Intervals)
Example:
Monthly inventory values over a quarter:
April: $40,000
May: $60,000
June: $50,000
Average = ($40,000 + $60,000 + $50,000) ÷ 3 = $50,000
This method smooths out anomalies and gives a clearer picture of typical stock levels.
Using Inventory Management Software
Modern ERP and inventory systems like NetSuite, TradeGecko, or Zoho Inventory automatically track daily stock movements and can generate real-time average inventory reports. These tools reduce human error and allow dynamic analysis based on live data.
Integrating Average Inventory Into Key Business Metrics
Calculating average inventory is only useful when applied to broader financial and operational indicators. Here are two critical formulas that rely on it:
1. Inventory Turnover Ratio
This shows how often inventory is sold and replaced over a period.
Formula:
Inventory Turnover = Cost of Goods Sold (COGS) ÷ Average Inventory
Example:
COGS for the year: $600,000
Average Inventory: $75,000
Turnover = $600,000 ÷ $75,000 = 8 times per year
A higher turnover generally indicates efficient operations, though industry benchmarks vary.
2. Days Sales of Inventory (DSI)
This reveals how many days it takes to sell the entire inventory.
Formula:
DSI = (Average Inventory ÷ COGS) × 365
Using the same example:
DSI = ($75,000 ÷ $600,000) × 365 ≈ 45.6 days
This means it takes about 46 days on average to clear current stock—a valuable insight for planning restocks.
| Metric | Purpose | Formula |
|---|---|---|
| Average Inventory | Measure typical stock level | (Beginning + Ending) ÷ 2 |
| Inventory Turnover | Evaluate sales efficiency | COGS ÷ Average Inventory |
| Days Sales of Inventory (DSI) | Assess stock liquidity | (Average Inventory ÷ COGS) × 365 |
Real-World Application: Mini Case Study
Scenario: “Bloom & Vine,” a boutique flower distributor, struggled with inconsistent deliveries and frequent stockouts during peak seasons. Their monthly inventory varied wildly—from $30,000 to $90,000—depending on weddings and holidays.
They began tracking average inventory using weekly snapshots:
- Week 1: $30,000
- Week 2: $45,000
- Week 3: $70,000
- Week 4: $90,000
Average Weekly Inventory = ($30K + $45K + $70K + $90K) ÷ 4 = $58,750
With this baseline, they recalculated their inventory turnover (COGS: $700,000/year):
Turnover = $700,000 ÷ $58,750 ≈ 11.9 times/year
Armed with accurate data, Bloom & Vine adjusted supplier contracts, implemented staggered deliveries, and reduced excess purchases. Within six months, carrying costs dropped by 18%, and stockout incidents fell by 65%.
Common Mistakes to Avoid
Even experienced managers can misinterpret inventory data. Watch out for these pitfalls:
- Using inconsistent valuation methods: Mixing FIFO and LIFO without adjustment distorts trends.
- Relying on single-point counts: A year-end count alone doesn’t reveal seasonal buildup.
- Ignoring obsolete stock: Dead inventory inflates averages and skews turnover ratios.
- Not aligning COGS and inventory periods: Mismatched timelines lead to incorrect turnover calculations.
Checklist: How to Calculate and Use Average Inventory Effectively
- ✅ Define the reporting period (month, quarter, etc.)
- ✅ Record beginning and ending inventory values consistently
- ✅ Apply the same costing method (FIFO, etc.) throughout
- ✅ For volatile inventory, use multiple interval readings
- ✅ Cross-check with COGS to calculate turnover and DSI
- ✅ Compare results against industry benchmarks
- ✅ Review trends over time to spot inefficiencies
Frequently Asked Questions
Can I calculate average inventory in units instead of dollars?
Yes. While dollar value is standard for financial reporting, unit-based averages are helpful for operational planning—especially when dealing with uniform products. Just ensure consistency in measurement.
What if my inventory drops to zero during the period?
Zero inventory doesn’t invalidate the calculation, but it signals a potential supply gap. Use such cases to investigate root causes like poor forecasting or supplier issues. The formula still applies: (Beginning + Ending) ÷ 2.
How often should I recalculate average inventory?
Monthly is ideal for most businesses. High-turnover industries (e.g., grocery, fashion) may benefit from weekly calculations. Stable operations can use quarterly assessments.
Conclusion: Turn Data Into Action
Mastering how to calculate average inventory is more than a bookkeeping task—it’s a strategic advantage. With accurate figures, businesses can fine-tune purchasing, reduce waste, improve cash flow, and respond proactively to market changes. Whether you run a small shop or manage a large warehouse, treating inventory as a dynamic metric—not a static number—empowers smarter decisions.


 浙公网安备
33010002000092号
浙公网安备
33010002000092号 浙B2-20120091-4
Comments
No comments yet. Why don't you start the discussion?