
Managing inventory efficiently is a cornerstone of operational success—whether you run a small retail store, an e-commerce business, or oversee warehouse logistics. A well-structured Excel inventory spreadsheet can replace costly software for many businesses while offering full customization and control. Unlike rigid platforms, Excel adapts to your workflow, allowing real-time tracking, data analysis, and reporting without ongoing subscription fees.
Despite its accessibility, many users underutilize Excel, creating cluttered sheets that confuse more than clarify. The key lies in thoughtful design, consistent formatting, and automation where possible. This guide walks through the process of building a functional, scalable inventory system in Excel that saves time, reduces errors, and improves decision-making.
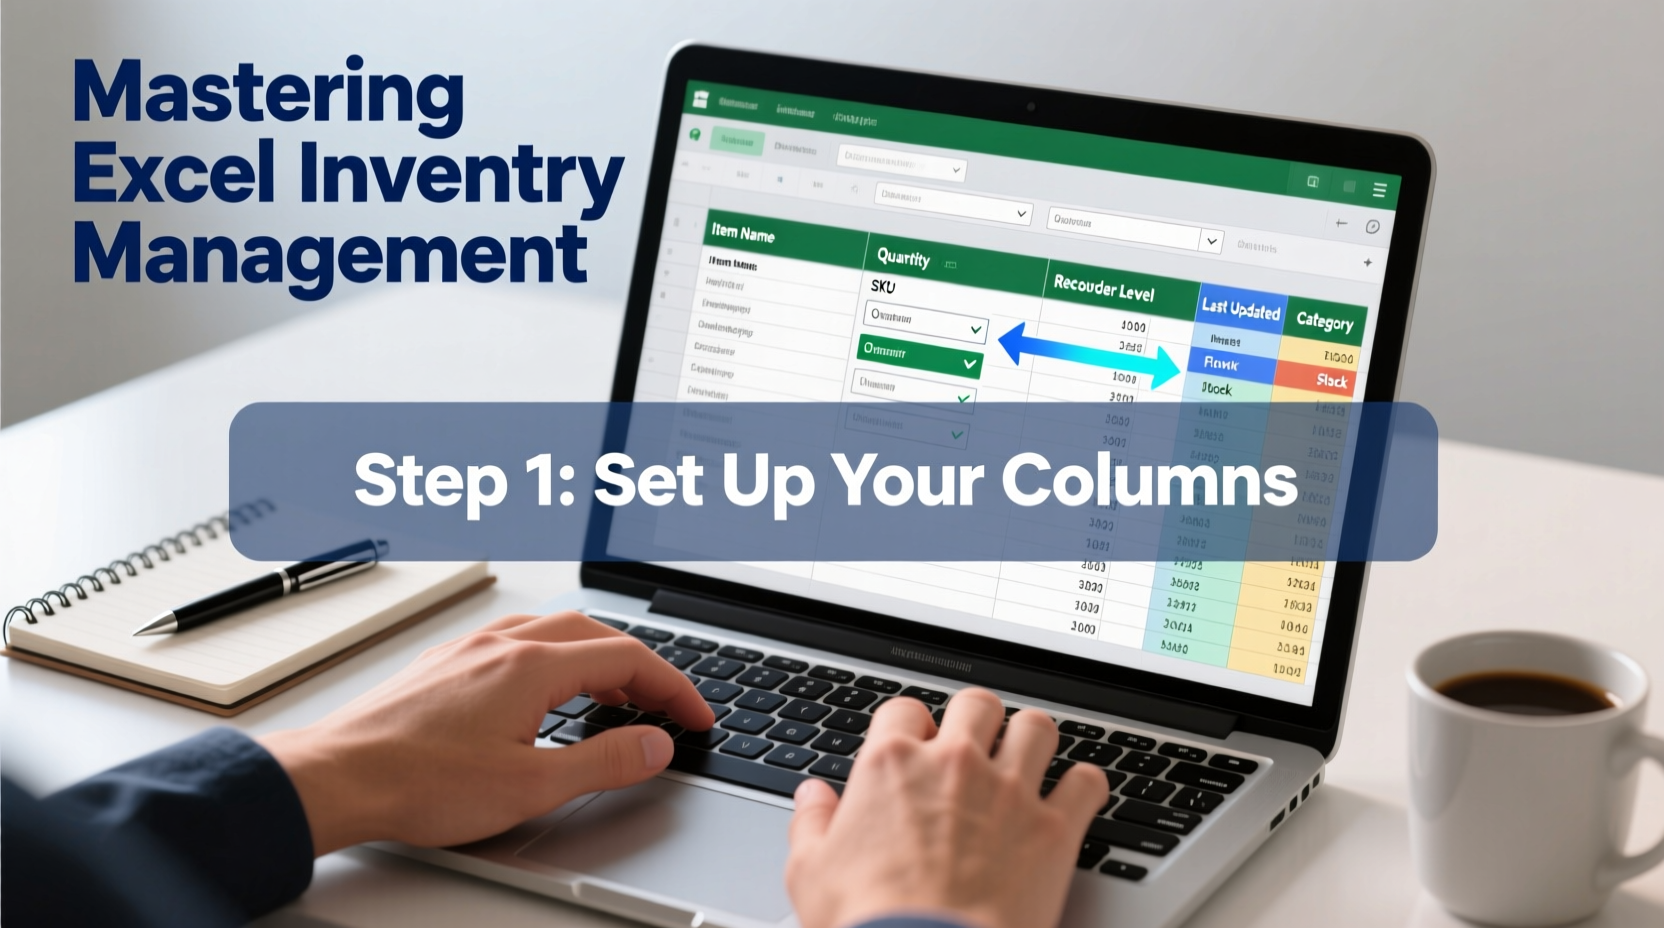
1. Define Your Inventory Structure
Before opening Excel, outline what you’re tracking. Different products require different data points. For example, perishable goods need expiration dates, while electronics may require serial numbers. Start by listing all item categories and identifying essential attributes for each.
A basic inventory structure should include:
- Item Name
- SKU (Stock Keeping Unit)
- Category
- Quantity in Stock
- Reorder Level
- Unit Cost
- Sale Price
- Supplier Information
- Last Restock Date
- Location (e.g., Shelf A3, Warehouse B)
Once defined, this structure becomes the foundation of your spreadsheet. Open Excel and create column headers in Row 1 corresponding to each field. Freeze the top row (View → Freeze Panes) so headers remain visible when scrolling.
2. Build Your Spreadsheet: Step-by-Step Setup
With your structure in place, it’s time to build the actual spreadsheet. Follow these steps to ensure clarity and functionality:
- Create a new workbook and rename Sheet1 to “Inventory” for clarity.
- Enter column headers in Row 1: A1 = Item Name, B1 = SKU, C1 = Category, etc.
- Format headers with bold text and a contrasting background color (e.g., dark blue with white text).
- Adjust column width to prevent text overflow. Double-click the line between column headers to auto-fit.
- Apply borders to cells for visual separation (Home → Borders).
- Enable filters (Data → Filter) to allow quick sorting by category, stock level, or supplier.
To enhance usability, consider adding conditional formatting to highlight low-stock items. Select the “Quantity in Stock” column, go to Home → Conditional Formatting → Highlight Cells Rules → Less Than, and enter your reorder threshold (e.g., 10). Choose a red fill to flag urgent restocks.
3. Automate Key Calculations
One of Excel’s greatest strengths is its ability to automate repetitive tasks. Use formulas to reduce manual entry and minimize errors.
Key formulas to implement:
| Function | Purpose | Formula Example |
|---|---|---|
| TOTAL VALUE | Calculate total inventory value | =SUMPRODUCT(D:D, F:F) — multiplies quantity by cost for all rows |
| LOW STOCK ALERT | Flag items below reorder level | =IF(D2<E2, \"Reorder\", \"\") — assumes D=Qty, E=Reorder Level |
| PROFIT MARGIN | Show per-item profit | =H2-F2 — assumes H=Sale Price, F=Cost |
| INVENTORY AGE | Track how long items have been in stock | =TODAY()-I2 — subtracts restock date from today |
For advanced users, combine functions like IF, AND, and VLOOKUP to create dynamic dashboards. For instance, use VLOOKUP to pull supplier contact details from a separate “Suppliers” sheet based on SKU.
4. Real-World Application: A Small Retailer’s Success
Jamie runs a boutique selling handmade candles and bath products. Before using Excel, she relied on handwritten ledgers and often ran out of bestsellers during peak seasons. After building a structured inventory spreadsheet, she automated reordering alerts and tracked seasonal trends.
She set up her sheet with columns for scent type, wax volume, wick size, batch date, and customer demand rating. Using conditional formatting, she highlighted items with less than five units in stock. She also added a “Monthly Sales” column and used simple charts to identify top performers.
Within three months, Jamie reduced overstock by 30% and eliminated missed sales due to stockouts. “The spreadsheet paid for itself in two weeks,” she said. “Now I know exactly when to order more lavender soy candles before summer hits.”
“An organized inventory system isn’t just about counting stock—it’s about understanding flow, predicting demand, and reducing waste.” — Carlos Mendez, Operations Consultant
5. Best Practices Checklist
To maintain accuracy and efficiency, follow this checklist regularly:
- ✅ Update inventory counts weekly or after major sales
- ✅ Audit physical stock monthly and reconcile with spreadsheet data
- ✅ Back up your file to cloud storage (Google Drive, OneDrive) daily
- ✅ Use data validation to restrict input (e.g., only positive numbers in quantity fields)
- ✅ Color-code categories (e.g., green for electronics, blue for apparel)
- ✅ Create a separate sheet for suppliers with contact info and lead times
- ✅ Archive old data annually to keep the file fast and manageable
Consider protecting sensitive sheets with a password (Review → Protect Sheet) if multiple team members access the file. Allow editing only in designated columns like “Quantity” or “Notes” to prevent accidental changes to formulas.
Frequently Asked Questions
Can I use this system for multiple locations?
Yes. Add a “Location” column and use filters or pivot tables to view stock by warehouse, store, or shelf. For complex setups, create separate sheets labeled “Store A,” “Store B,” and link them via formulas to a master summary sheet.
How do I handle returns or damaged goods?
Add a “Status” column with options like “In Stock,” “Damaged,” “Returned,” or “Pending Inspection.” You can then filter damaged items and adjust inventory accordingly. Deduct quantities from available stock and log the reason in a notes column.
Is Excel secure enough for inventory data?
For small to mid-sized operations, yes—especially if files are encrypted and stored securely. However, for enterprises with high transaction volumes or regulatory compliance needs, consider upgrading to database-driven tools later. Excel remains ideal for startups and growing businesses seeking flexibility.
Conclusion: Take Control of Your Inventory Today
An effective Excel inventory spreadsheet is more than a digital ledger—it's a strategic tool that empowers smarter purchasing, reduces waste, and improves cash flow. By defining your structure, automating calculations, and maintaining consistency, you create a system that scales with your business.
The effort invested in setting up a clean, intelligent spreadsheet pays dividends in time saved, errors avoided, and insights gained. Whether you're managing ten products or a thousand, the principles remain the same: clarity, accuracy, and proactive monitoring.


 浙公网安备
33010002000092号
浙公网安备
33010002000092号 浙B2-20120091-4
Comments
No comments yet. Why don't you start the discussion?