
Modern processors are powerful, but they generate significant heat under load. Left unchecked, excessive temperatures can throttle performance, shorten component lifespan, or even cause system instability. For users running intensive tasks—such as gaming, video editing, or software development—monitoring CPU temperature isn't just helpful; it's essential. This guide walks through the most reliable methods to monitor your processor’s thermal behavior in Windows 10, using both third-party tools and built-in diagnostics.
Why Monitoring CPU Temperature Matters
Heat is the enemy of electronic longevity. While modern CPUs include thermal safeguards that trigger automatic shutdowns when overheating occurs, relying solely on these safety nets is risky. Frequent thermal throttling reduces performance, and sustained high temperatures degrade silicon over time.
Consistent monitoring allows you to detect cooling issues early—like dust-clogged fans, failing thermal paste, or inadequate airflow—before they result in hardware damage. It also helps optimize overclocking efforts by ensuring stability within safe thermal limits.
“Temperature monitoring is not reactive—it’s preventive. A few degrees above normal could signal a failing fan or airflow obstruction.” — Dr. Alan Reyes, Hardware Systems Engineer at PC Dynamics Lab
How to Check CPU Temperature Using Trusted Software Tools
Windows 10 does not provide native CPU temperature readings in Task Manager or Settings. To access accurate thermal data, you need specialized monitoring software that reads sensor values from the motherboard and processor directly.
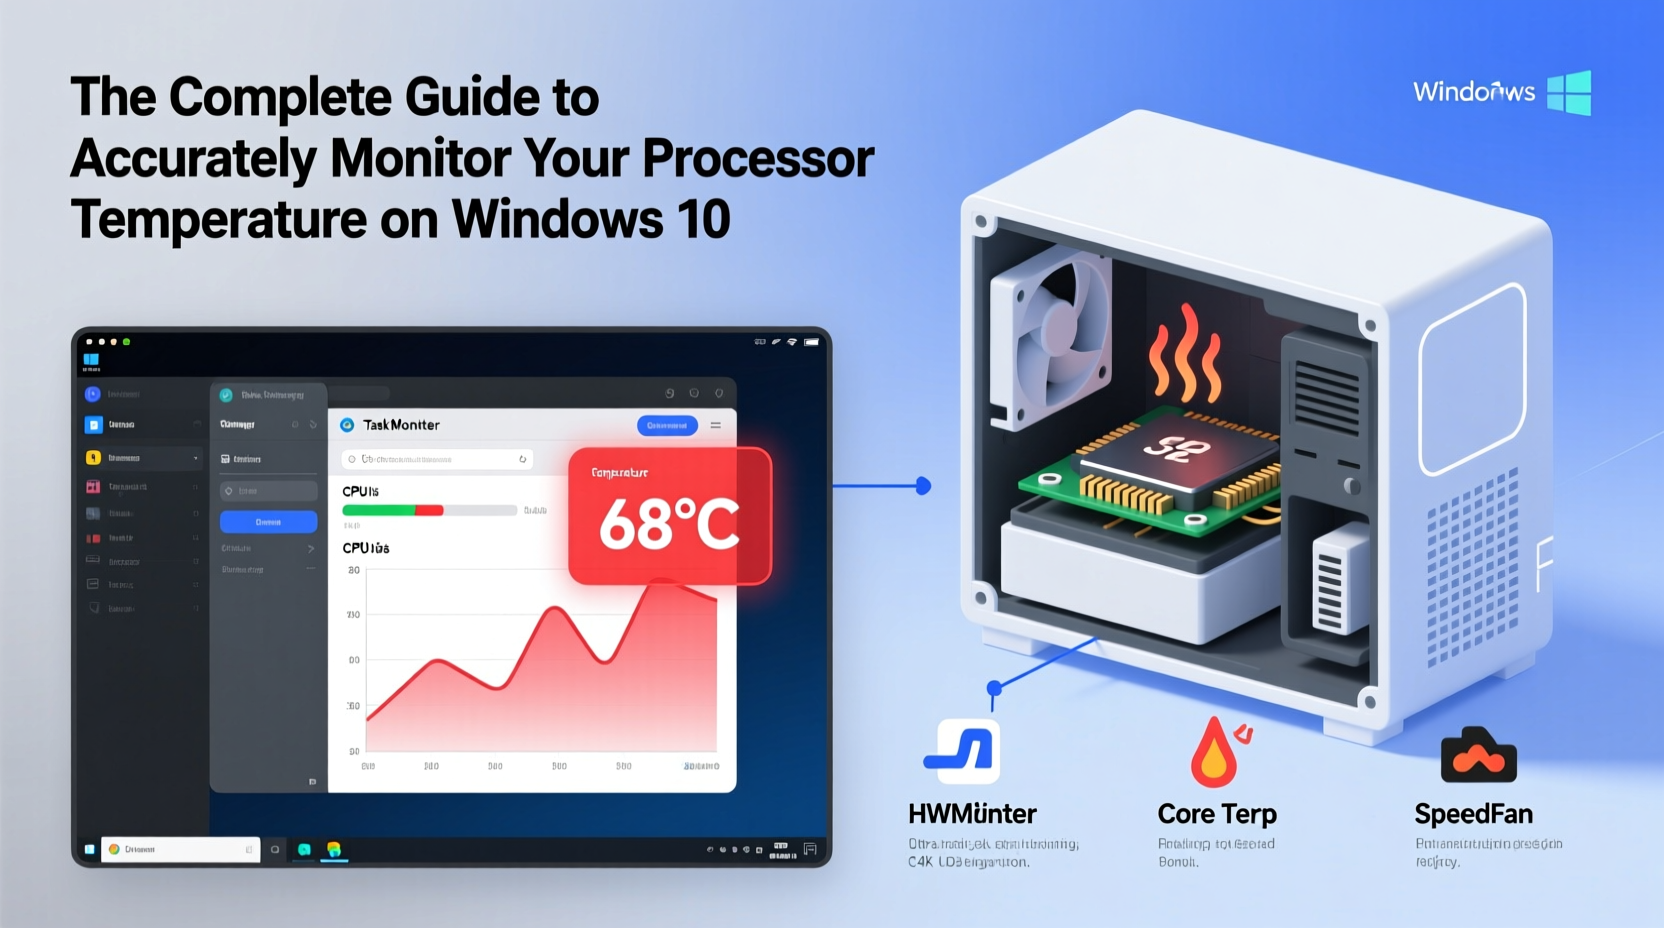
The following tools are widely respected for accuracy, ease of use, and low system impact:
- HWMonitor (by CPUID): Displays real-time voltage, fan speeds, and temperatures for all major components.
- Core Temp: Lightweight, per-core temperature display with optional system tray integration.
- Open Hardware Monitor: Open-source alternative with customizable interface and logging support.
- Speccy (by Piriform): User-friendly dashboard-style view, though less granular than others.
- MSI Afterburner (with RivaTuner): Primarily for GPU tuning, but includes robust system monitoring overlays.
Step-by-Step: Installing and Using Core Temp
- Download Core Temp from the official website (alcpu.com/CoreTemp).
- Install the application and launch it.
- Observe temperature readings displayed next to each CPU core in the main window.
- Enable “Show Tray Icon” in Settings to monitor temps from the taskbar.
- Right-click the tray icon to access min/max temperature tracking and alerts.
Core Temp runs efficiently in the background and supports startup launch, making it ideal for continuous monitoring without performance overhead.
Understanding Normal vs. Dangerous CPU Temperatures
Not all heat levels are equal. What’s considered “normal” depends on your processor model, workload, and cooling solution. Here’s a general reference table:
| CPU State | Acceptable Range | Action Required? |
|---|---|---|
| Idle (no load) | 35°C – 50°C | No |
| Light Use (browsing, office apps) | 45°C – 60°C | No |
| Heavy Load (gaming, rendering) | 70°C – 85°C | Monitor closely |
| Over 85°C (sustained) | Danger Zone | Yes – investigate cooling |
| Over 95°C (peak) | Thermal Throttling Likely | Immediate action needed |
Intel and AMD specify maximum operating temperatures (often labeled Tjunction or TJMAX) in their technical documentation. Exceeding this threshold—even briefly—can trigger throttling or shutdowns. For example, many Intel Core i7 processors have a TJMAX of 100°C, while AMD Ryzen chips typically cap at 90–95°C.
Real-World Example: Diagnosing Overheating in a Gaming Rig
A user reported frequent frame drops during extended gaming sessions. Initial checks showed full GPU utilization and no background processes interfering. However, using HWMonitor, peak CPU temperatures reached 97°C during gameplay—well into throttling territory.
Upon inspection, the air cooler’s fan was spinning slower than rated, and dust had accumulated on the heatsink fins. After cleaning the unit and reapplying thermal paste, idle temps dropped from 48°C to 37°C, and load temps stabilized at 79°C. Performance improved noticeably, and crashes ceased.
This case illustrates how temperature monitoring transforms guesswork into actionable insight. Without real-time data, the root cause might have been misdiagnosed as a driver or power issue.
Do’s and Don’ts of CPU Temperature Management
| Do | Don’t |
|---|---|
| Monitor temps under different workloads | Ignore rising idle temperatures over time |
| Clean internal components every 3–6 months | Place laptops on soft surfaces like beds or pillows |
| Use quality thermal paste during rebuilds | Assume BIOS sensors are always accurate without cross-checking |
| Ensure proper case airflow and vent clearance | Run stress tests without monitoring tools active |
| Update BIOS and firmware for better thermal management | Overclock without verifying cooling headroom first |
Advanced Monitoring: Logging and Alerts
For users managing workstations or servers, passive observation isn’t enough. You need historical data to identify trends and automate responses.
Tools like Open Hardware Monitor allow you to log temperature data to CSV files over time. This enables analysis of thermal patterns across days or weeks—especially useful when evaluating the effectiveness of new cooling upgrades.
Some advanced utilities support alert systems. For instance, HWInfo offers configurable alarms that trigger notifications or scripts when temperatures exceed thresholds. You can set it to automatically reduce performance via power plan switching or shut down non-essential applications.
Checklist: Ensuring Accurate CPU Temperature Readings
- ✅ Confirm your CPU model supports digital thermal sensors (DTS).
- ✅ Use updated versions of monitoring software.
- ✅ Cross-reference readings between two tools (e.g., Core Temp and HWMonitor).
- ✅ Avoid running untrusted benchmarking or tuning software that may skew results.
- ✅ Ensure administrator privileges are granted to monitoring apps for full sensor access.
- ✅ Reboot and retest if temperatures appear inconsistent or implausible.
Frequently Asked Questions
Can monitoring software damage my CPU?
No. These tools only read sensor data—they do not interact with hardware controls or alter voltages. They consume minimal resources and pose no risk to your system.
Why do different programs show different temperatures?
Variations occur due to differences in sensor polling frequency, interpretation of raw data, or which specific thermal diode is being read. Always rely on consistent trends rather than absolute values from one tool alone.
Is it safe to run my CPU at 90°C?
Short bursts up to 90°C are generally acceptable, especially under heavy load. However, sustained operation near this level accelerates wear and increases the risk of throttling. Aim to keep long-term loads below 85°C for optimal reliability.
Conclusion: Take Control of Your System’s Thermal Health
Accurately monitoring your processor temperature on Windows 10 empowers you to maintain peak performance, prevent unexpected shutdowns, and extend the life of your hardware. With free, reliable tools available and straightforward setup procedures, there’s no reason to operate blind to one of the most critical aspects of system health.


 浙公网安备
33010002000092号
浙公网安备
33010002000092号 浙B2-20120091-4
Comments
No comments yet. Why don't you start the discussion?