
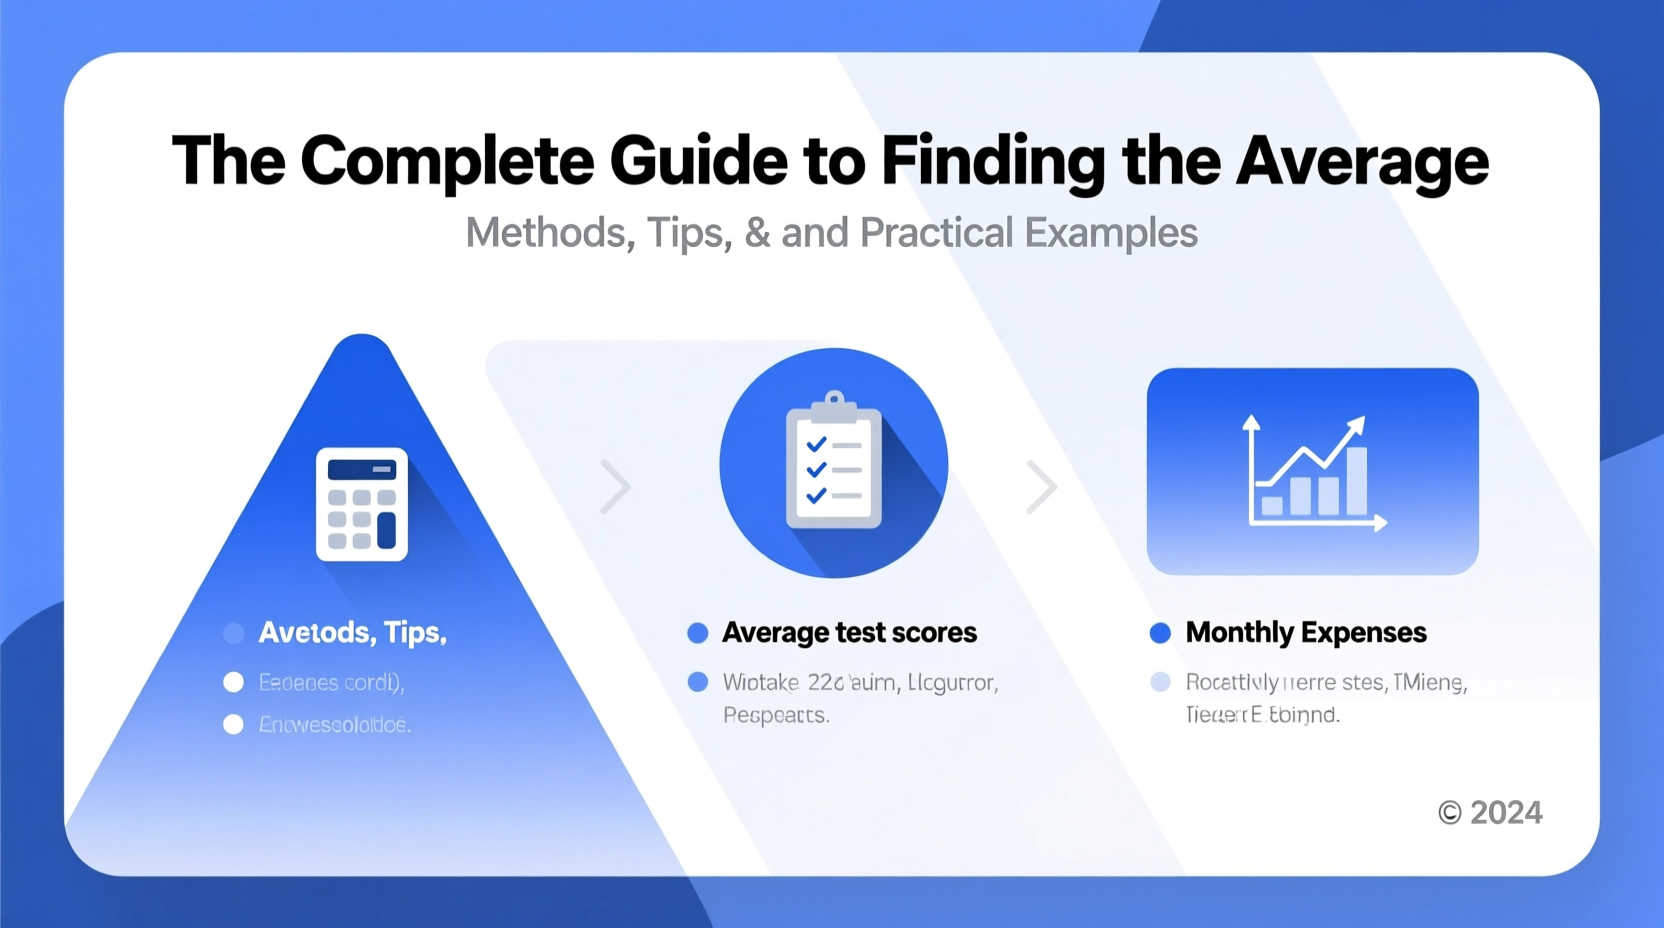
Understanding how to find an average is a foundational skill in mathematics, data analysis, business reporting, and everyday decision-making. Whether you're analyzing test scores, tracking monthly expenses, or evaluating performance metrics, knowing which averaging method to use—and how to apply it correctly—can make the difference between insightful conclusions and misleading results. This guide explores the most common types of averages, when to use them, and how to avoid common pitfalls.
Understanding the Different Types of Averages
The term \"average\" is often used generically, but in practice, there are several distinct measures of central tendency: mean, median, and mode. Each serves a different purpose and is best suited for specific data scenarios.
- Arithmetic Mean: The sum of all values divided by the number of values. Most commonly referred to as \"the average.\"
- Median: The middle value in a sorted list. Ideal when outliers skew the data.
- Mode: The most frequently occurring value. Useful for categorical data.
Choosing the right type depends on your data distribution and objective. For example, income data often uses the median because extreme high earners can distort the mean.
Step-by-Step Guide to Calculating the Arithmetic Mean
The arithmetic mean is the most widely used average. Follow these steps to calculate it accurately:
- Gather all numerical data points relevant to your analysis.
- Add up all the values to get the total sum.
- Count the number of values in your dataset.
- Divide the sum by the count.
Formula: Mean = (Sum of Values) / (Number of Values)
For example, if a student scored 85, 90, 78, 92, and 88 on five tests:
(85 + 90 + 78 + 92 + 88) / 5 = 433 / 5 = 86.6
Their average test score is 86.6.
Weighted Average: When Some Values Matter More
In real-world applications, not all data points carry equal importance. A weighted average assigns different weights based on significance.
Formula: Weighted Average = Σ(Value × Weight) / Σ(Weights)
Example: A course grade is based on homework (30%), midterm (25%), final exam (35%), and participation (10%). If a student scores 90%, 85%, 94%, and 98% respectively:
(90×0.30) + (85×0.25) + (94×0.35) + (98×0.10) = 27 + 21.25 + 32.9 + 9.8 = 90.95
Their weighted average is 90.95%.
When to Use Median Over Mean
The median is particularly valuable when dealing with skewed distributions. Unlike the mean, it is not influenced by extreme values.
Consider housing prices in a neighborhood where most homes sell for $300,000–$400,000, but one mansion sells for $5 million. Including that outlier would drastically inflate the mean, making it unrepresentative of typical prices.
To find the median:
- Arrange data in ascending order.
- If the count is odd, pick the middle number.
- If even, average the two middle numbers.
Example: Salaries ($40k, $45k, $50k, $55k, $120k). The median is $50k, while the mean is $62k—demonstrating how the outlier pulls the mean upward.
“Using the median in income analysis prevents distortion from top-tier earners and gives a more realistic picture of economic well-being.” — Dr. Lena Torres, Economist at Urban Data Institute
Practical Applications and Real-World Examples
Mini Case Study: Small Business Profit Tracking
A boutique coffee shop owner wants to assess her average monthly profit over six months. Her net profits are: $3,200, $3,800, $2,900, $4,100, $3,500, and $15,000 (a holiday surge).
Arithmetic mean: (3,200 + 3,800 + 2,900 + 4,100 + 3,500 + 15,000) / 6 = $5,416.67
Median: Sorted values → $2,900, $3,200, $3,500, $3,800, $4,100, $15,000 → Median = (3,500 + 3,800)/2 = $3,650
The mean suggests strong profitability, but the median reveals that typical months are far less lucrative. For budgeting, she should rely on the median to avoid overestimating regular income.
Using Mode in Customer Behavior Analysis
A clothing retailer tracks the most common size sold in a week: S, M, L, M, S, M, XL, M, M.
The mode is M (appears 5 times), indicating that stocking more medium-sized items aligns with demand.
Common Mistakes and How to Avoid Them
Misapplying averaging methods leads to flawed interpretations. Below is a comparison of common errors and correct practices.
| Mistake | Why It’s Problematic | Best Practice |
|---|---|---|
| Using mean with highly skewed data | Outliers distort the result | Use median for skewed distributions |
| Igoring data frequency | Equal weighting may misrepresent reality | Apply weighted averages when appropriate |
| Calculating average of averages | Leads to incorrect aggregation | Recalculate using original data totals |
| Applying mean to non-numeric categories | Mathematically invalid | Use mode for categorical data |
Checklist: Ensuring Accurate Average Calculations
- ✅ Verify that all data is numerical (unless using mode for categories)
- ✅ Sort data before finding the median
- ✅ Check for outliers that could skew the mean
- ✅ Determine if values have different weights or importance
- ✅ Recalculate from raw data instead of averaging precomputed averages
- ✅ Choose the appropriate average type based on context
Frequently Asked Questions
Can I average percentages directly?
Not always. Averaging percentages without considering their base values can be misleading. For example, 50% of 20 and 10% of 1000 yield very different actual values. Recalculate using total sums and totals rather than averaging percentages themselves.
What if my data has multiple modes?
A dataset can be bimodal (two modes) or multimodal (more than two). This is common in survey responses or product preferences. Report all modes and consider what the distribution reveals about user behavior.
Is the geometric mean ever useful?
Yes. The geometric mean is used for growth rates, investment returns, or data spanning orders of magnitude. It’s calculated by multiplying all values and taking the nth root. For example, annual growth rates of 1.1, 1.2, and 0.9: geometric mean = ∛(1.1 × 1.2 × 0.9) ≈ 1.06, or 6% average growth.
Conclusion: Apply the Right Average with Confidence
Finding the average is more than just plugging numbers into a formula—it requires thoughtful consideration of data type, distribution, and purpose. Whether you're managing personal finances, analyzing business KPIs, or interpreting survey results, mastering the nuances of mean, median, and mode empowers you to draw accurate, meaningful conclusions. By applying the right method and avoiding common traps, you turn raw data into reliable insight.


 浙公网安备
33010002000092号
浙公网安备
33010002000092号 浙B2-20120091-4
Comments
No comments yet. Why don't you start the discussion?