
In microeconomics, indifference curves are a fundamental tool used to model consumer behavior. They represent combinations of two goods that yield the same level of satisfaction to a consumer. While their downward slope is intuitive—more of one good means less of another to maintain equal utility—their convex shape is more nuanced. Understanding why indifference curves are convex provides deep insight into how people make trade-offs in real-life consumption decisions.
The convexity of an indifference curve reflects a core principle: as a consumer has more of one good, they are willing to give up less and less of the other good to obtain additional units. This phenomenon is rooted in the concept of diminishing marginal rate of substitution (MRS), which itself stems from the law of diminishing marginal utility. Let’s explore the mechanics behind this shape and its implications for economic analysis.
The Principle of Diminishing Marginal Rate of Substitution
The marginal rate of substitution (MRS) measures how much of good Y a consumer is willing to give up to get one more unit of good X while remaining equally satisfied. On an indifference curve, the MRS is represented by the absolute value of the slope at any given point.
As a consumer moves down along a convex indifference curve—consuming more of good X and less of good Y—the MRS decreases. This decline occurs because the marginal utility of good X diminishes with each additional unit consumed, while the marginal utility of good Y increases due to its growing scarcity in the bundle.
For example, imagine a person consuming apples and oranges. If they have many apples but few oranges, they value oranges more highly and would be willing to trade several apples for just one orange. But as they acquire more oranges, each additional orange becomes less valuable relative to apples, so they’re no longer willing to give up as many apples for another orange.
“Convexity captures the essence of realistic human choice: we prefer balance over extremes.” — Dr. Linda Chen, Behavioral Economist, University of Chicago
Diminishing Marginal Utility and Its Role
At the heart of convexity lies the law of diminishing marginal utility: each additional unit of a good provides less incremental satisfaction than the previous one. This psychological reality shapes how consumers substitute between goods.
When a consumer starts with a bundle heavy in good X and light in good Y, the marginal utility of Y is high, and that of X is low. Therefore, they are eager to substitute X for Y. As the mix becomes more balanced, the urgency to substitute declines, flattening the slope of the indifference curve.
This behavior leads to a curve that bends inward toward the origin—convex when viewed from above. A straight line (perfect substitutes) or a right angle (perfect complements) would imply no change in substitution willingness, which rarely reflects actual consumer behavior.
Graphical Interpretation of Convexity
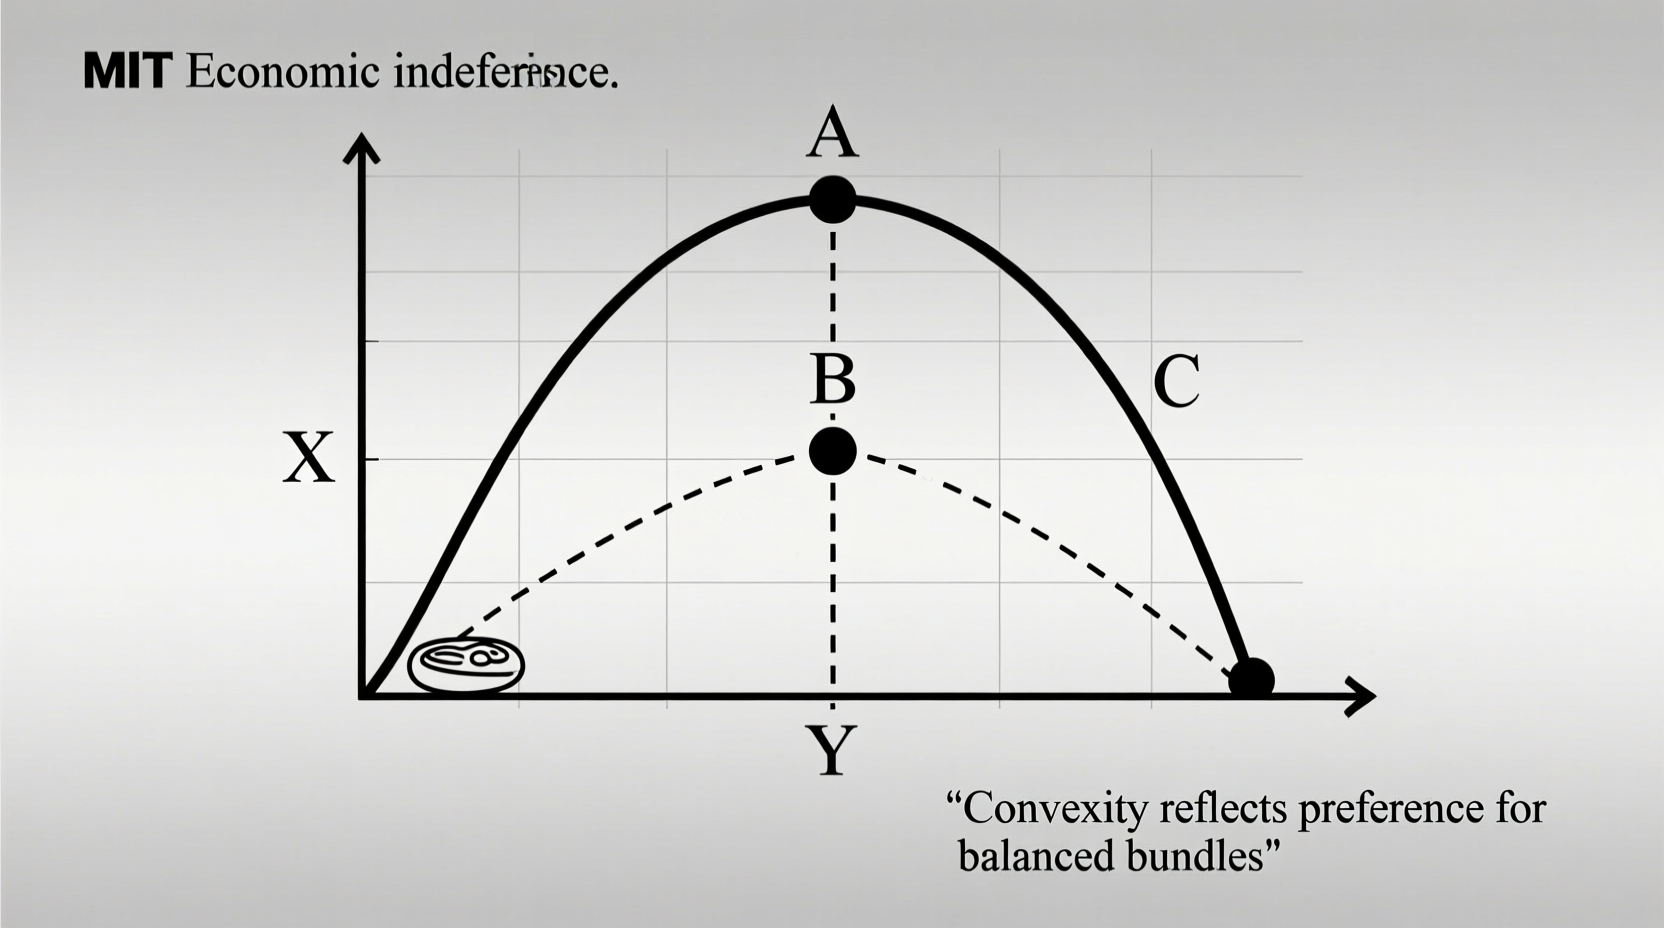
Visually, convex indifference curves bow inward toward the origin. This curvature ensures that any weighted average of two bundles on the same curve will lie on a higher (preferred) indifference curve—a property known as strict convexity.
In technical terms, if bundle A and bundle B provide the same utility, then any combination like 50% A + 50% B must be preferred. This reflects the idea that moderate, diversified consumption bundles are generally more satisfying than extreme ones.
For instance, a person may be indifferent between having 10 cups of coffee and no tea versus no coffee and 10 teas. However, a mix of 5 coffees and 5 teas is likely to be more enjoyable than either extreme, pushing it onto a higher indifference curve. This preference for averages over extremes is precisely what convexity models.
Real-World Example: Food and Leisure Time
Consider a college student balancing meals and free time. Suppose they face a choice between studying (to earn money for food) and relaxing. Initially, if they have abundant free time but little food, they’d gladly sacrifice several hours of leisure for one extra meal. But as meals become plentiful and leisure time scarce, each additional meal is worth fewer hours of relaxation.
Their indifference curves between “meals per week” and “hours of leisure” will be convex. At high leisure levels, the MRS of leisure for food is low; at low leisure levels, it's high. The changing trade-off creates the characteristic bowed shape, illustrating how priorities shift with availability.
This example shows that convexity isn’t just a mathematical convenience—it mirrors real behavioral patterns across diverse domains, from budgeting time to allocating resources in households.
Exceptions and Special Cases
While most indifference curves are convex, exceptions exist based on the nature of the goods involved:
| Type of Goods | Indifference Curve Shape | Rationale |
|---|---|---|
| Perfect Substitutes (e.g., red & blue pens) | Straight line | Consumer always trades one-for-one regardless of quantities |
| Perfect Complements (e.g., left & right shoes) | L-shaped (right angle) | No substitution possible; goods must be consumed together |
| Bads (e.g., pollution, risk) | May be concave or non-standard | More of the \"bad\" reduces utility, altering trade-off logic |
| Most normal goods (e.g., food, clothing) | Convex | Diminishing MRS applies due to satiation and variety preference |
These cases highlight that convexity is not universal but arises under typical conditions where variety is preferred and marginal utility diminishes.
Checklist: Identifying Convex Indifference Behavior
To determine whether two goods likely generate convex indifference curves, ask:
- Does consuming more of one good reduce the desire for additional units?
- Is there a natural limit to how much of one good a person wants without the other?
- Would a balanced mix of both goods feel more satisfying than an extreme bundle?
- Do consumers tend to diversify their consumption over time?
- Is the marginal value of one good dependent on how much of the other is available?
If most answers are yes, convexity is a reasonable assumption.
Implications for Consumer Equilibrium
The convex shape plays a critical role in determining optimal consumption. When combined with a budget constraint—a straight line reflecting market prices—the point of tangency between the budget line and the highest attainable indifference curve identifies the consumer’s optimal choice.
Because the indifference curve is convex and the budget line is linear, there is typically a unique solution where MRS equals the price ratio (PX/PY). This equilibrium reflects both preference and affordability, ensuring stability in demand predictions.
If indifference curves were concave, the optimal choice would often occur at a corner solution (all of one good, none of the other), which contradicts observed behavior for most product pairs. Convexity thus supports interior solutions that align with diversified spending patterns.
Frequently Asked Questions
Why can't indifference curves be concave?
Concave curves imply increasing marginal rate of substitution, meaning consumers value goods more the scarcer they become—a pattern inconsistent with typical behavior. It would lead to unstable or extreme consumption choices, which are rarely observed. Concavity violates the assumption of preference for diversity and diminishing marginal utility.
Does convexity mean consumers always prefer balanced bundles?
Generally, yes—under standard assumptions. Convexity implies that averages are at least as good as extremes, and strictly convex curves mean averages are strictly preferred. This doesn’t mean perfect balance is ideal, but rather that some variety tends to increase overall satisfaction compared to specializing in one good.
Can a consumer have multiple convex indifference curves?
Absolutely. Each curve represents a different level of total utility. Higher (further from the origin) convex curves indicate greater satisfaction. Together, they form an indifference map that fully describes a consumer’s preferences across all possible bundles.
Conclusion: Embracing the Logic of Choice
The convex shape of indifference curves is far more than a geometric detail—it embodies a profound truth about human behavior. People naturally seek balance, adapt their desires based on what they have, and derive more satisfaction from variety than excess. By modeling these tendencies, economists gain predictive power over purchasing decisions, policy impacts, and market dynamics.
Understanding why indifference curves are convex equips students, analysts, and policymakers with a clearer lens on decision-making. Whether evaluating tax changes, designing pricing strategies, or interpreting household budgets, recognizing the forces behind convexity brings depth to economic reasoning.


 浙公网安备
33010002000092号
浙公网安备
33010002000092号 浙B2-20120091-4
Comments
No comments yet. Why don't you start the discussion?