
Los Angeles is synonymous with traffic. Whether you're a resident, visitor, or just watching from afar, the image of endless brake lights crawling down the 405 or I-10 at rush hour has become iconic. But why exactly is LA traffic so notoriously bad? It’s not just about too many cars—it’s a complex interplay of geography, history, infrastructure, and culture. Understanding the roots of this congestion reveals not only how we got here but also what can realistically be done to improve mobility in one of America’s largest metropolitan areas.
The Geography Trap: Natural Barriers and Limited Expansion
One of the most underappreciated factors behind LA’s traffic woes is its physical geography. Nestled between the Pacific Ocean to the west and mountain ranges like the Santa Monica and San Gabriel Mountains to the north and east, Los Angeles is effectively boxed in. This natural confinement limits outward expansion and forces development—and traffic—into narrow corridors.
Major freeways such as the 101, 110, and 134 funnel commuters through these constrained paths, creating unavoidable bottlenecks. For example, the interchange between the 101 and 134 in the Cahuenga Pass is a notorious chokepoint precisely because there are no alternative routes over the hills.
Urban Sprawl and Car-Centric Development
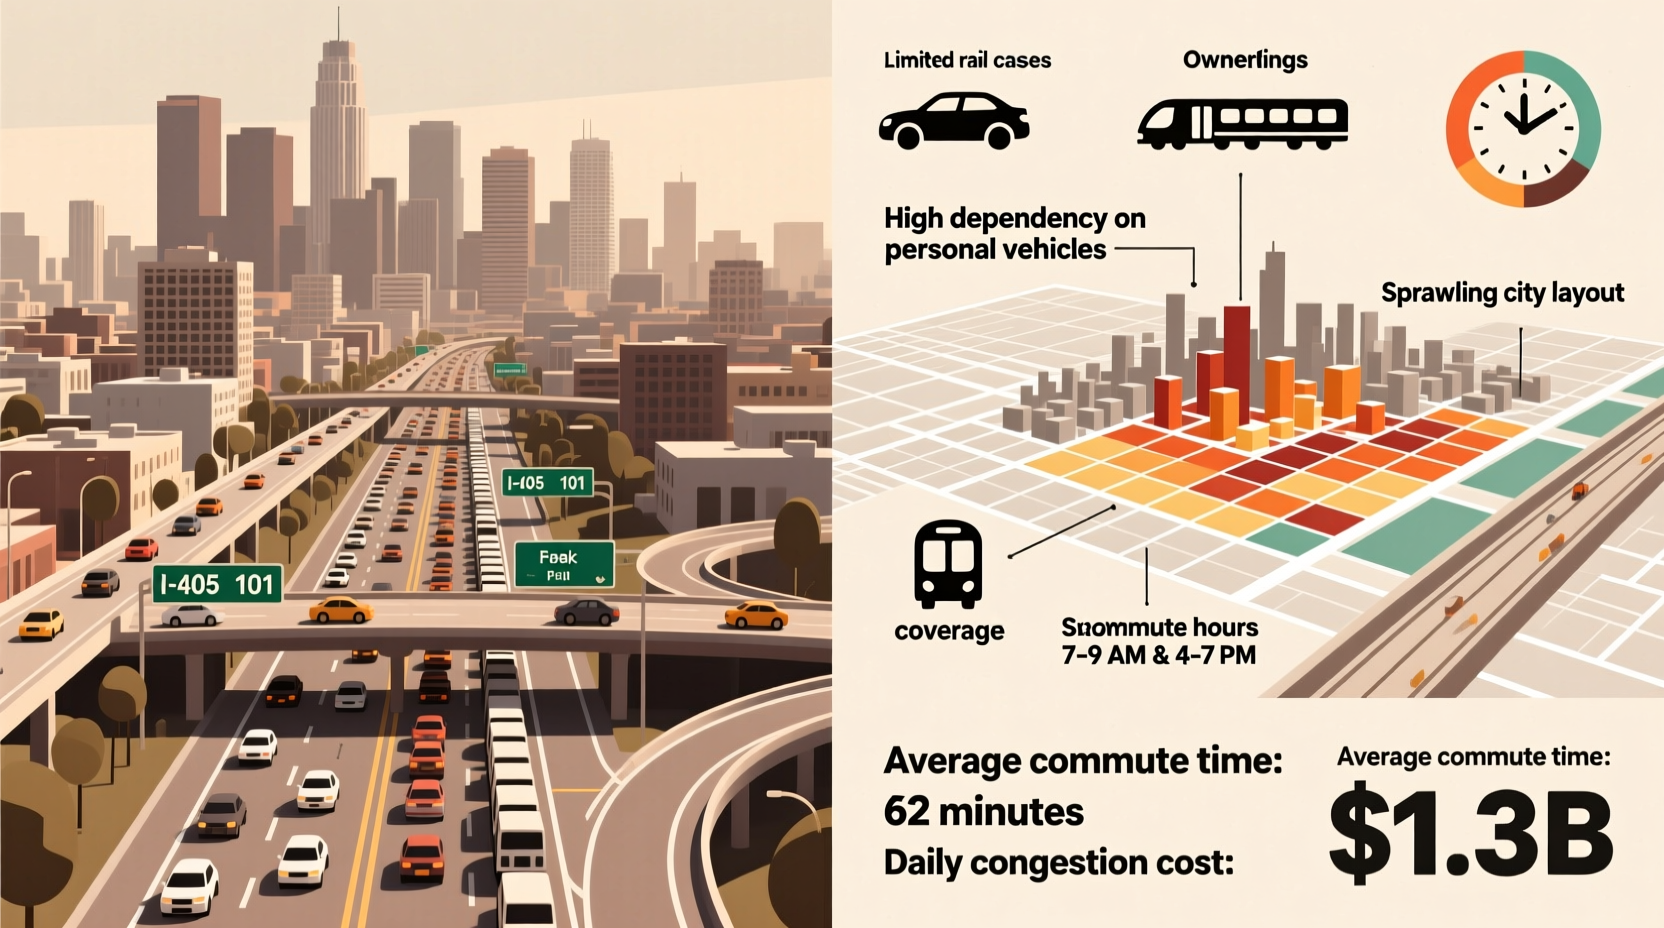
Los Angeles didn’t always have terrible traffic. In the early 20th century, it was served by an extensive streetcar system known as the Pacific Electric Railway. But as automobiles became more affordable and real estate developers promoted suburban living, the city underwent rapid decentralization.
Zoning laws encouraged low-density housing, separating homes, jobs, schools, and shopping into distinct zones. This design necessitates long commutes and makes walking, biking, or public transit impractical for most daily tasks. The result? A sprawling metropolis where nearly every trip requires a car.
A 2022 study by the Urban Land Institute found that LA County has one of the lowest job-housing balance ratios in the nation—meaning people often live far from where they work, increasing vehicle miles traveled (VMT) and congestion.
Freeway Infrastructure: Built for the Past, Not the Future
The backbone of LA’s transportation network—the freeway system—was largely designed in the 1940s and 1950s, when the region had a fraction of today’s population. While some expansions have occurred, the pace of growth has far outstripped infrastructure upgrades.
Adding lanes seems like a logical fix, but it often triggers “induced demand”—a phenomenon where new road capacity quickly fills up because it encourages more people to drive. The $1 billion renovation of the 405 through the Sepulveda Pass, completed in 2014, initially reduced travel times. Within months, however, congestion returned as drivers shifted back to the route or started making new trips.
| Freeway | Peak Congestion Level (INRIX 2023) | Avg. Delay per Driver (hours/year) |
|---|---|---|
| I-405 | Severe | 104 |
| I-10 | High | 87 |
| US-101 | High | 82 |
| SR-110 | Moderate | 61 |
“LA built a world-class freeway system in the 1950s—but then stopped investing while the population tripled. We’re still driving on the bones of mid-century infrastructure.” — Dr. Martin Wachs, Urban Planning Professor Emeritus, UCLA
Cultural Dependence on Cars
No discussion of LA traffic is complete without addressing the city’s deep-rooted car culture. For generations, owning a car in Los Angeles hasn’t just been convenient—it’s been a symbol of freedom, status, and identity. This cultural attachment discourages behavioral shifts toward shared or active transportation.
Despite improvements in Metro Rail and bike lanes, only about 5% of LA County commuters use public transit regularly, according to the US Census Bureau. Many residents cite infrequent service, long transfer times, and safety concerns as barriers.
Meanwhile, ride-sharing services like Uber and Lyft, intended to reduce car ownership, have inadvertently increased congestion. A 2018 study by the Union of Concerned Scientists found that ride-hailing adds the equivalent of 5.7 million additional vehicle miles annually in Southern California, mostly due to “deadheading”—driving without passengers.
What Can Be Done? Realistic Solutions for Reducing Congestion
Fixing LA’s traffic problem won’t happen overnight, but targeted strategies can make a meaningful difference over time.
1. Expand Reliable Public Transit
Projects like the Regional Connector and the Purple Line extension aim to link key employment centers with faster, seamless rail options. To maximize impact, service frequency must improve, and last-mile connectivity—such as bike-sharing and shuttle feeds—should be prioritized.
2. Embrace Transit-Oriented Development
New housing near transit hubs reduces dependency on cars. Cities like Santa Monica and Culver City are leading the way with mixed-use zoning, allowing residents to live, work, and shop within walking distance.
3. Implement Smart Pricing Strategies
Congestion pricing—charging higher tolls during peak hours—has worked in cities like London and Singapore. Pilot programs on high-occupancy toll (HOT) lanes in LA could expand to cover more freeways, using revenue to fund transit improvements.
Mini Case Study: The Success of the K Line
When the Metro K Line opened in 2022, connecting Inglewood to downtown LA, initial ridership exceeded projections by 30%. Local businesses reported increased foot traffic, and apartment complexes near stations began marketing proximity to transit as a premium feature. This demonstrates that when reliable, safe, and well-integrated transit exists, people will use it—even in car-centric LA.
Actionable Checklist: Navigating LA Traffic Smarter
- Check real-time traffic via Waze or Google Maps before leaving
- Avoid peak commute windows (7–9 AM and 4–7 PM) when possible
- Use carpool lanes and consider joining a vanpool program
- Plan errands in geographic clusters to minimize backtracking
- Explore Metro Rail for cross-town trips, especially on the B, D, or K lines
- Support local initiatives that promote denser, walkable neighborhoods
Frequently Asked Questions
Is LA really the worst city for traffic?
According to INRIX’s Global Traffic Scorecard, LA consistently ranks among the top three US cities for total annual delay per driver. In 2023, the average LA commuter lost 102 hours to congestion—second only to Chicago. However, cities like Boston and New York have higher per-mile delay rates due to tighter street grids.
Can remote work solve LA’s traffic problem?
Hybrid and remote work models have reduced peak-hour congestion since 2020, but gains are stabilizing. As offices reopen, traffic is rebounding. While telecommuting helps, it’s not a full solution—especially for essential workers, service employees, and industries requiring on-site presence.
Why doesn’t LA build more freeways?
There’s little room left to expand. Most viable corridors are already developed, and new construction faces intense community opposition due to noise, pollution, and displacement concerns. Moreover, evidence shows that adding lanes rarely provides lasting relief due to induced demand.
Conclusion: Rethinking Mobility in the City of Angels
LA’s traffic isn’t just a nuisance—it’s a symptom of deeper structural challenges rooted in decades of planning choices, geographic constraints, and cultural norms. While there’s no single fix, progress is possible through sustained investment in transit, smarter land use, and behavioral change.
The future of Los Angeles mobility depends less on building more roads and more on reimagining how people move. Every resident can contribute: by trying the bus, supporting denser housing, or simply shifting a meeting to avoid rush hour. Change starts with awareness—and now that you understand why LA traffic is so bad, you’re ready to be part of the solution.


 浙公网安备
33010002000092号
浙公网安备
33010002000092号 浙B2-20120091-4
Comments
No comments yet. Why don't you start the discussion?