
In economics, one of the most fundamental concepts is the downward-sloping demand curve. It visually represents a simple yet powerful idea: as the price of a good or service decreases, consumers are generally willing and able to buy more of it. Conversely, when prices rise, demand tends to fall. This inverse relationship between price and quantity demanded is not arbitrary—it is rooted in human behavior, psychological tendencies, and measurable economic forces. Understanding why the demand curve slopes downward provides insight into consumer decision-making and market dynamics.
The Law of Demand: Foundation of the Downward Slope
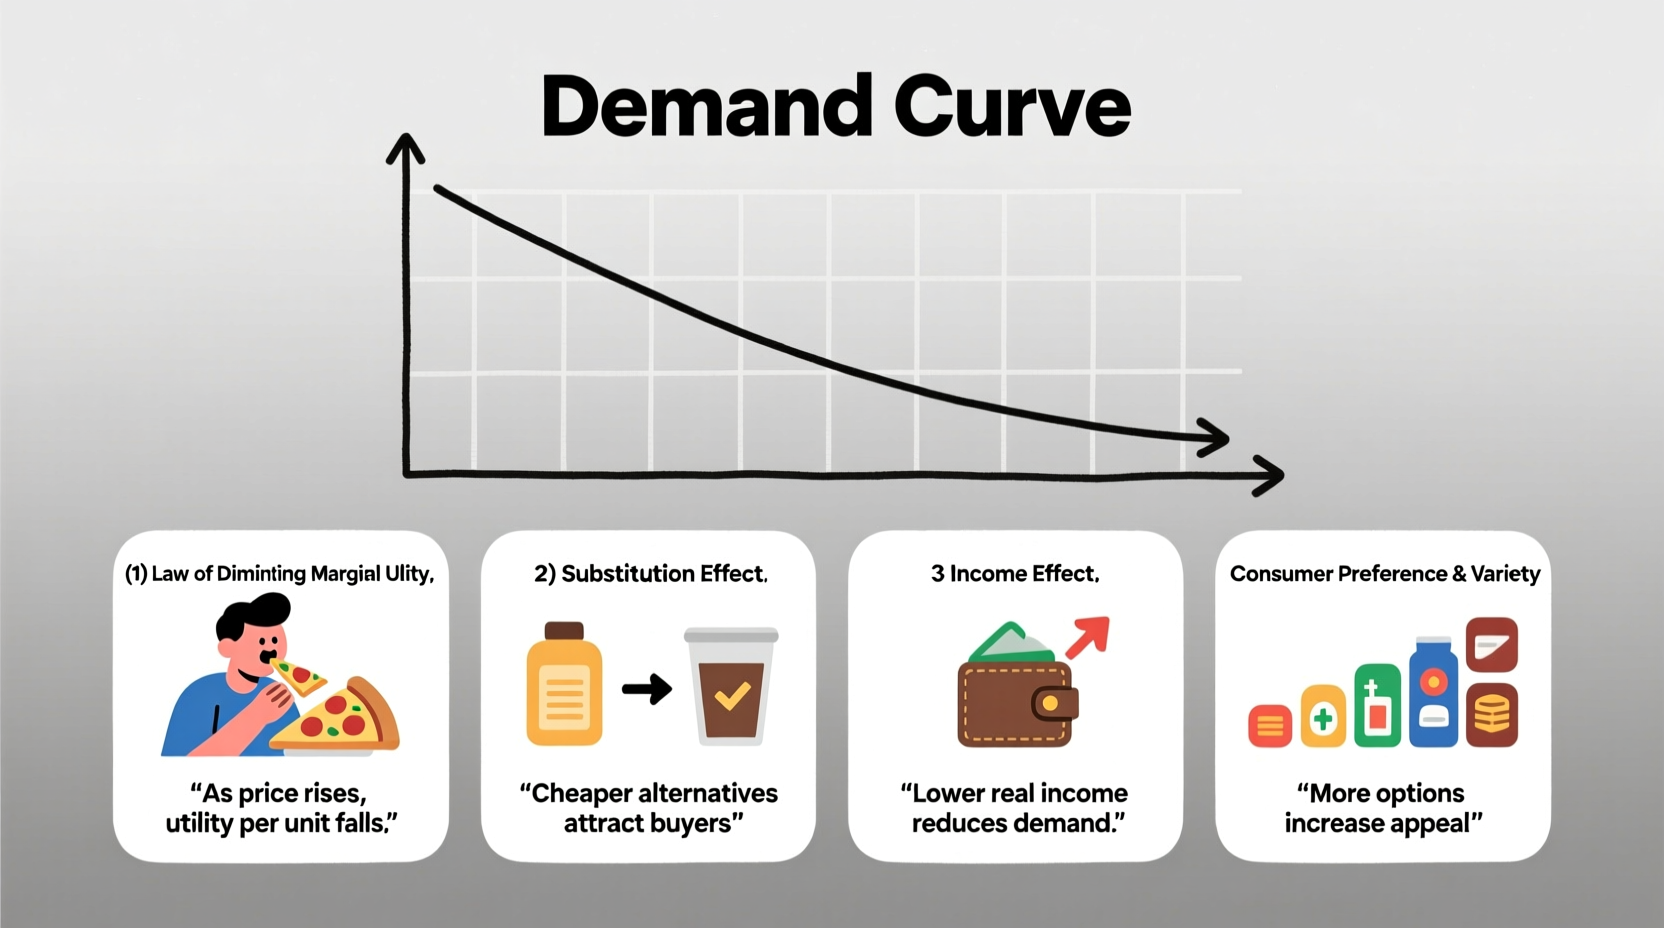
The law of demand states that, ceteris paribus (all else being equal), the quantity demanded of a good decreases as its price increases, and vice versa. This principle forms the basis for the downward slope of the demand curve. But why do consumers behave this way? The answer lies in several interrelated economic and behavioral mechanisms.
At its core, the law of demand reflects rational choice. Consumers aim to maximize satisfaction (or utility) within their budget constraints. When prices change, so do the trade-offs involved in purchasing decisions. The downward slope emerges from how individuals respond to these shifting incentives.
Diminishing Marginal Utility: Satisfaction Decreases with Use
One of the primary reasons the demand curve slopes downward is the concept of diminishing marginal utility. Marginal utility refers to the additional satisfaction a consumer gains from consuming one more unit of a good.
For example, imagine eating slices of pizza. The first slice brings significant satisfaction, especially if you're hungry. The second slice is still enjoyable, but less so than the first. By the fourth or fifth slice, you may feel full—or even uncomfortable. Each additional slice provides less incremental benefit than the one before.
This declining satisfaction means consumers are only willing to buy more units if the price drops. At higher prices, they’ll limit purchases to the units that deliver the most value. As prices fall, buying additional units becomes justifiable despite lower marginal utility.
Income Effect: Changing Purchasing Power
The income effect describes how a change in the price of a good affects a consumer’s real income—or purchasing power. When the price of a product falls, the same amount of money can now buy more of it, effectively increasing the consumer's real income.
For instance, if the price of coffee drops from $5 to $3 per cup, a consumer with $30 can now buy 10 cups instead of 6. This increase in effective income makes them feel wealthier, prompting them to buy more coffee—even if their actual salary hasn’t changed.
Conversely, when prices rise, real income falls. Consumers must cut back on purchases, either of the now-expensive good or others, to stay within budget. This reduction in quantity demanded contributes directly to the downward slope of the demand curve.
Substitution Effect: Switching to Better Deals
The substitution effect occurs when consumers replace a more expensive good with a cheaper alternative. If the price of beef rises significantly, some consumers may switch to chicken or plant-based proteins. Similarly, if streaming service A raises its subscription fee, users might migrate to service B.
This behavior reinforces the downward slope because higher prices make competing goods relatively more attractive. As a result, demand for the original product declines. On the flip side, when a product’s price drops, it becomes more competitive against substitutes, leading to increased demand.
The substitution effect is particularly strong for goods with close alternatives. Luxury items, branded products, and non-essentials tend to see greater responsiveness (elasticity) in demand due to substitution possibilities.
“Consumers are constantly weighing options. A price change doesn’t occur in isolation—it shifts the entire landscape of perceived value.” — Dr. Lena Patel, Behavioral Economist, University of Chicago
Real-World Example: Smartphone Market Dynamics
Consider the smartphone industry. When Apple releases a new iPhone at a premium price point, initial sales are strong among loyal customers and early adopters. However, as time passes and newer models emerge, older models are discounted.
At $999, the iPhone 14 appeals to a niche segment. But when its price drops to $699 six months later, demand surges. Why? The income effect allows more consumers to afford it. The substitution effect kicks in as buyers compare it to similarly priced Android phones and find better value. And diminishing marginal utility plays a role—most users don’t need the latest features, so a slightly older model at a lower price delivers sufficient satisfaction.
This lifecycle demonstrates how all three mechanisms work together to shape the downward-sloping demand curve in a tangible, observable market.
Factors That Influence the Steepness of the Demand Curve
While all demand curves slope downward, their steepness varies based on the nature of the good. Elasticity—how sensitive quantity demanded is to price changes—determines whether the curve is flat or steep.
| Type of Good | Elasticity | Demand Curve Shape | Example |
|---|---|---|---|
| Luxury Items | High (elastic) | Flatter | Sports cars |
| Necessities | Low (inelastic) | Steeper | Insulin |
| Goods with Substitutes | High | Flatter | Brand-name cereal |
| Goods without Substitutes | Low | Steeper | Patented medication |
A flatter curve indicates high elasticity—small price changes lead to large shifts in quantity demanded. A steeper curve suggests inelastic demand, where consumers continue buying regardless of moderate price increases, often due to necessity or lack of alternatives.
Common Misconceptions About the Demand Curve
It’s important to distinguish between movement along the demand curve and shifts of the curve itself. A price change causes movement along the curve—this is what the downward slope illustrates. However, changes in other factors—like income, preferences, population, or expectations—shift the entire curve left or right.
- Movement along the curve: Price of apples falls → quantity demanded increases.
- Shift of the curve: A health study declares apples improve longevity → demand increases at every price level.
Mistaking these two can lead to flawed analysis. The downward slope explains price-driven behavior; external influences require a broader framework.
Frequently Asked Questions
Can a demand curve ever slope upward?
Rarely, but yes. Giffen goods—typically inferior staples like potatoes during famines—and Veblen goods—luxury items like designer handbags—can exhibit upward-sloping demand curves. For Giffen goods, extreme poverty and lack of substitutes cause demand to rise with price. For Veblen goods, higher prices enhance perceived status, increasing desirability.
Does the downward slope apply to all markets?
Generally, yes—for individual consumers and standard goods. However, in cases of network effects (e.g., social media platforms) or speculative bubbles (e.g., cryptocurrencies), short-term deviations can occur. These are exceptions that prove the rule, not replacements for it.
How do businesses use the downward-sloping demand curve?
Firms analyze demand elasticity to set optimal prices. If demand is elastic, lowering prices can boost total revenue. If inelastic, raising prices may increase profits without losing many customers. This strategic pricing relies directly on understanding the slope of the demand curve.
Conclusion: Applying Economic Insight to Real Decisions
The downward slope of the demand curve is more than a textbook diagram—it’s a reflection of everyday choices. Whether deciding how many movie tickets to buy, which brand of coffee to choose, or when to upgrade a phone, consumers respond to price through the lens of utility, income, and alternatives.
Understanding these forces empowers both individuals and businesses. Consumers can make more informed spending decisions, while firms can design better pricing models, promotions, and product offerings. In a world of limited resources and unlimited wants, the demand curve remains a vital tool for navigating economic reality.


 浙公网安备
33010002000092号
浙公网安备
33010002000092号 浙B2-20120091-4
Comments
No comments yet. Why don't you start the discussion?